Projects

Waze App User Churn Analysis
Successfully analyzed user churn rate using waze app users dataset and constructed Machine learning model for predicting user churn (whether a user will churn or not)
Waze, a Google subsidiary, aims to create an ML model to anticipate user attrition among its app users. This model will utilize data collected from Waze app users.
Project Stack
Python, EDA, ML
Role
Data Analyst, Data Scientist
Services
EDA, Data viz, ML, Regression Modelling
After importing data, Exploratory data analysis was performed, further two-sample hypothesis test was conducted, Two ML models Random Forest and XGBoost models were constructed. Model scores were improved byb additional model tunning. Finally User churn was predicted via XGBoost ML Model as it appeared as champion model.
Waqas Ahmad – Data Analyst

Bike Rental Data Management
Created a comprehensive database management system with analytics-ready views for a project that integrated Citi Bike and weather datasets
Successfully created a flexible and efficient relational database to store bike rental data, using datasets from Citi Bike and NOAA
Project Stack
Python, SQL, RDBMS
Role
Data Analyst, Database developer
Services
EDA, Data Viz, Datbases, Query
"The project's codebase is readily accessible on GitHub, and you can explore its implementation through the Nbviewer for Jupyter Notebook"
Waqas Ahmad – Data Analyst
HR Analytics - Mercedes Benz
Successfully analyzed data collected by the HR department and constructed a robust predictive ML model that accurately forecast an employee's likelihood of leaving the company.
Objective was to identify core factors that play a role in employees choosing to leave the company by analyzing employee retintion and constructing a Machine Learning model for accurately predicting employee attrition
Project Stack
Python, EDA, Machine Learning
Role
Data Analyst, Data Scientist
Services
EDA, Data Viz, Processing, ML Models
"I began with data import and conducted exploratory data analysis (EDA), followed by a two-sample hypothesis test. I then built Random Forest and XGBoost models, improved their scores with model tuning, and selected XGBoost as the champion model for predicting user churn!"
Waqas Ahmad – Data Analyst
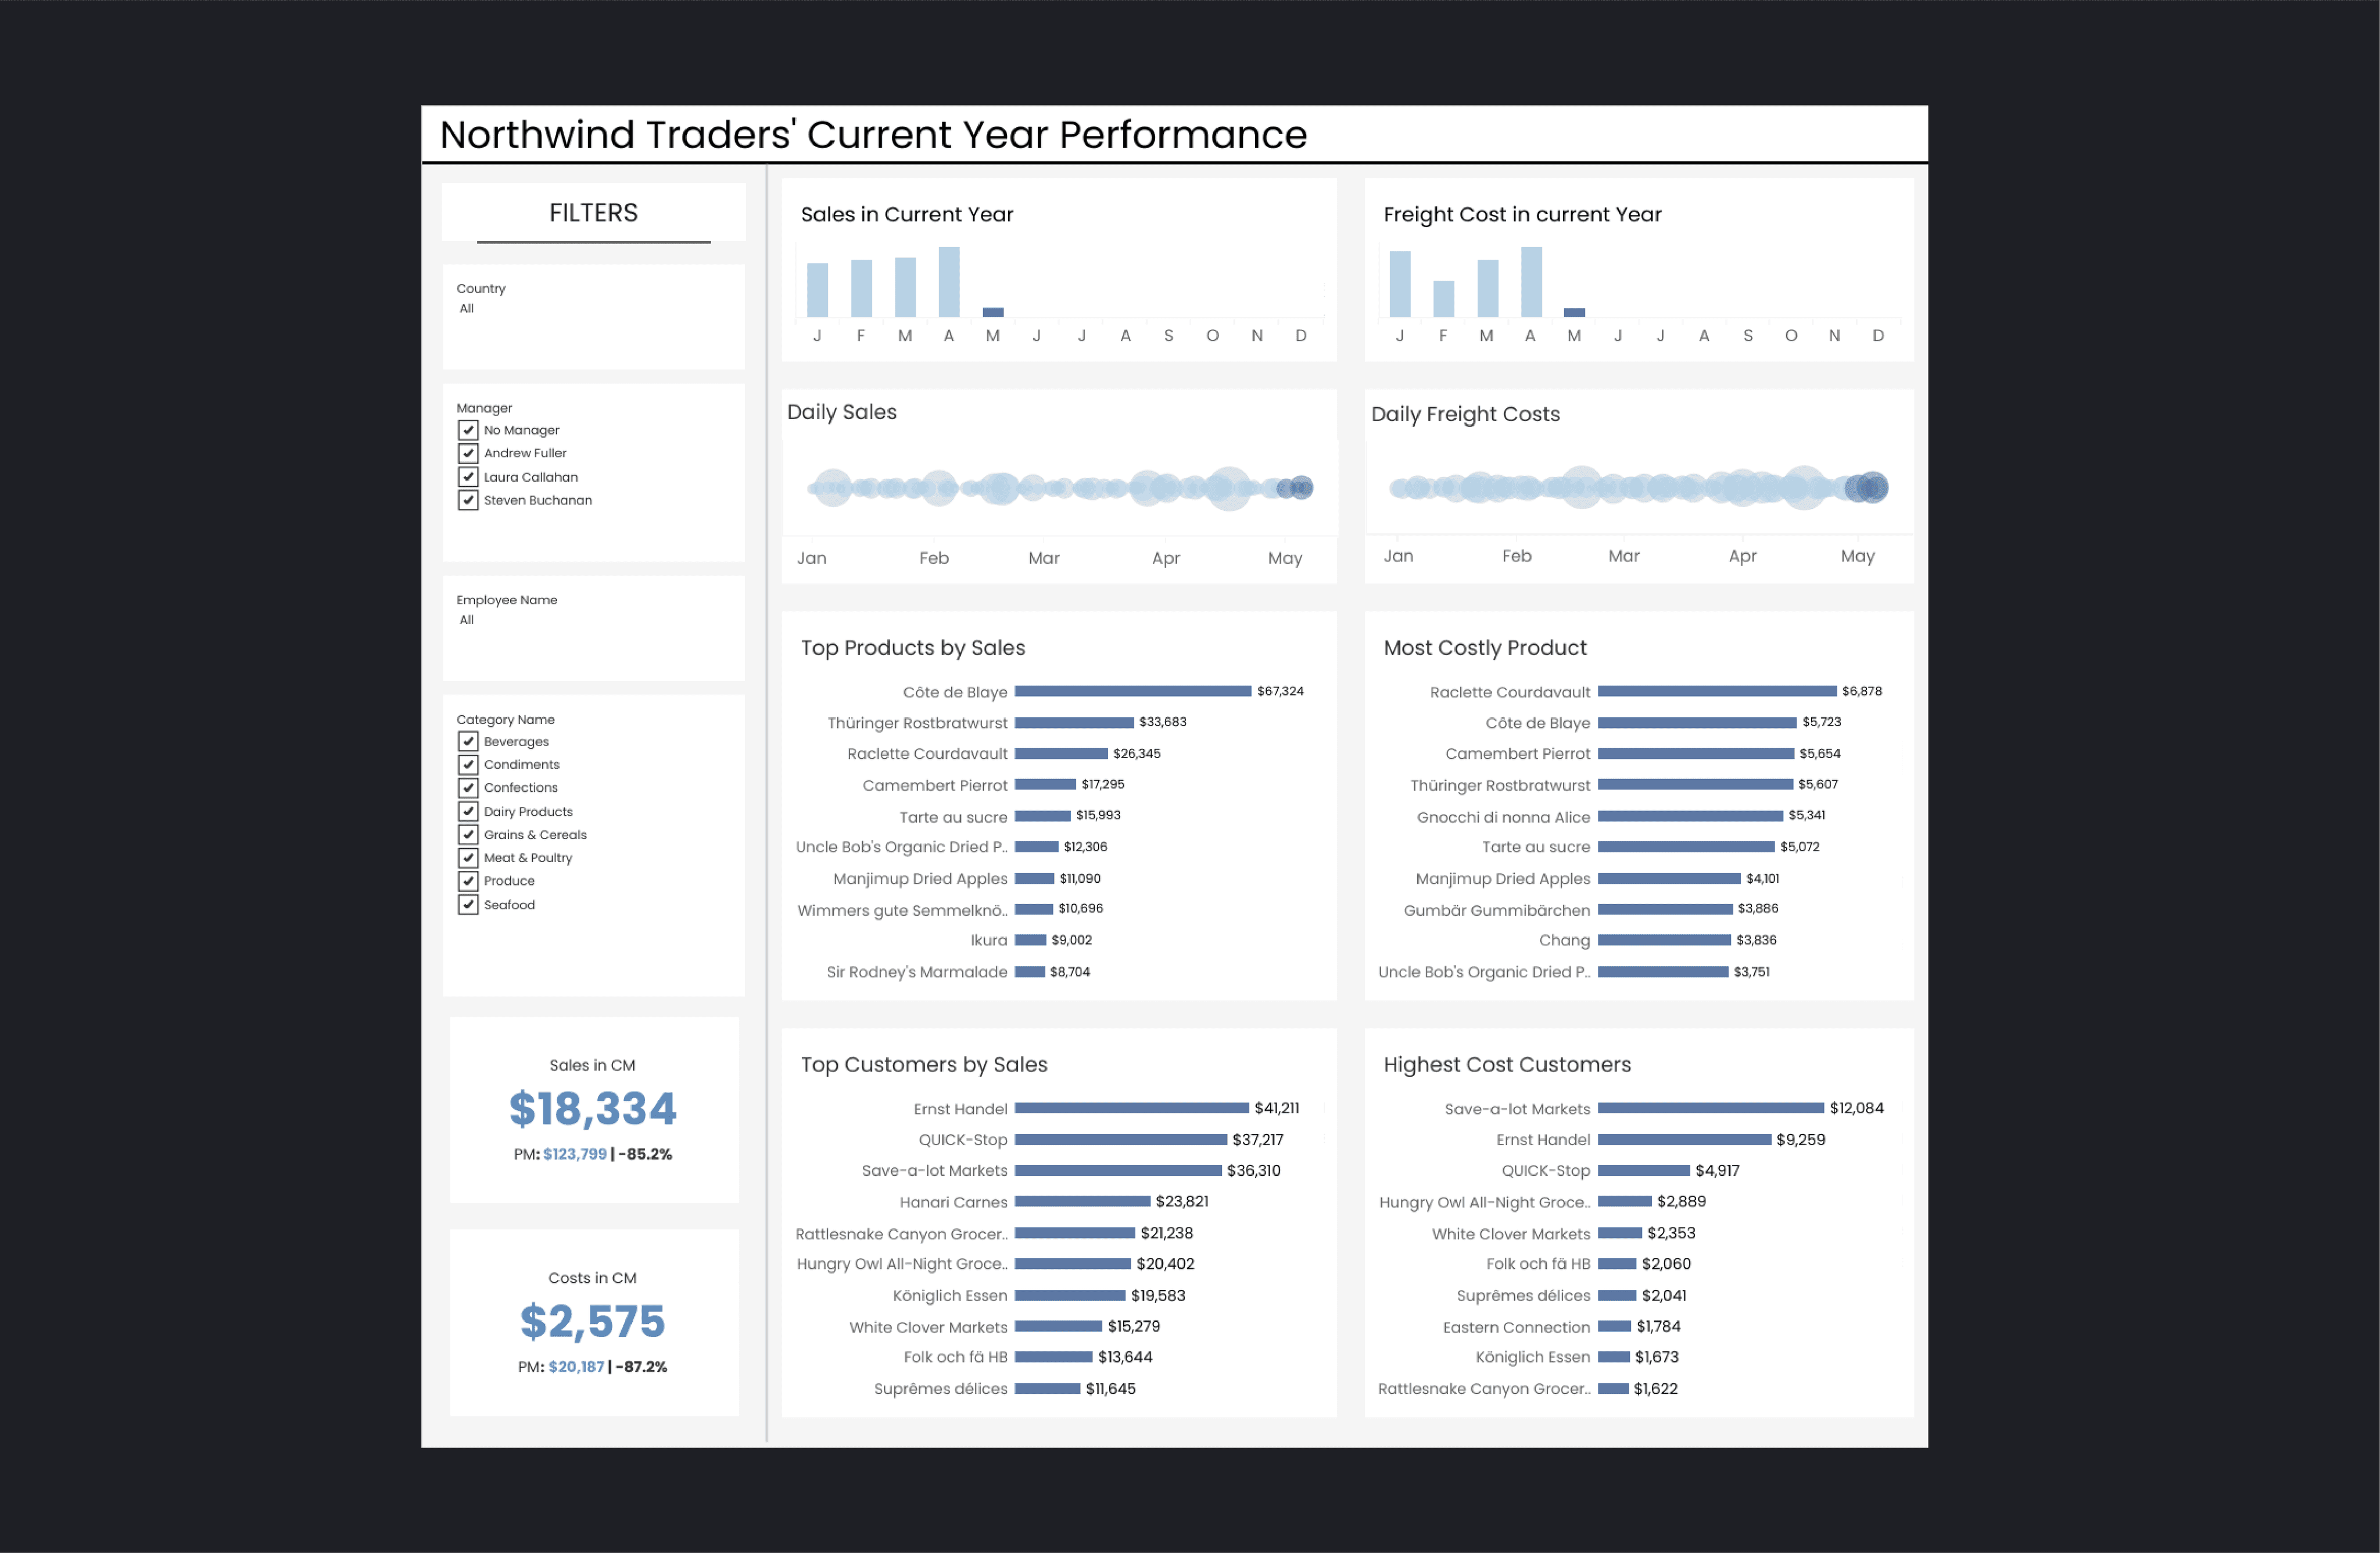
Northwind Performance Tracker
An interactive Tableau dashboard for Northwind Traders, empowering them to monitor monthly and daily sales, pinpoint top products, and analyze customer behavior.
This visually appealing tool provides real-time insights for effective business performance monitoring
Client
Northwind Traders
Role
Tableau Developer, Business Analyst
Services
BI, Dashboard, Data Visualization
"Working with Jessie Mendez has been an absolute game-changer for our business. We couldn't be happier with the results!"
Waqas Ahmad – Tableau Developer
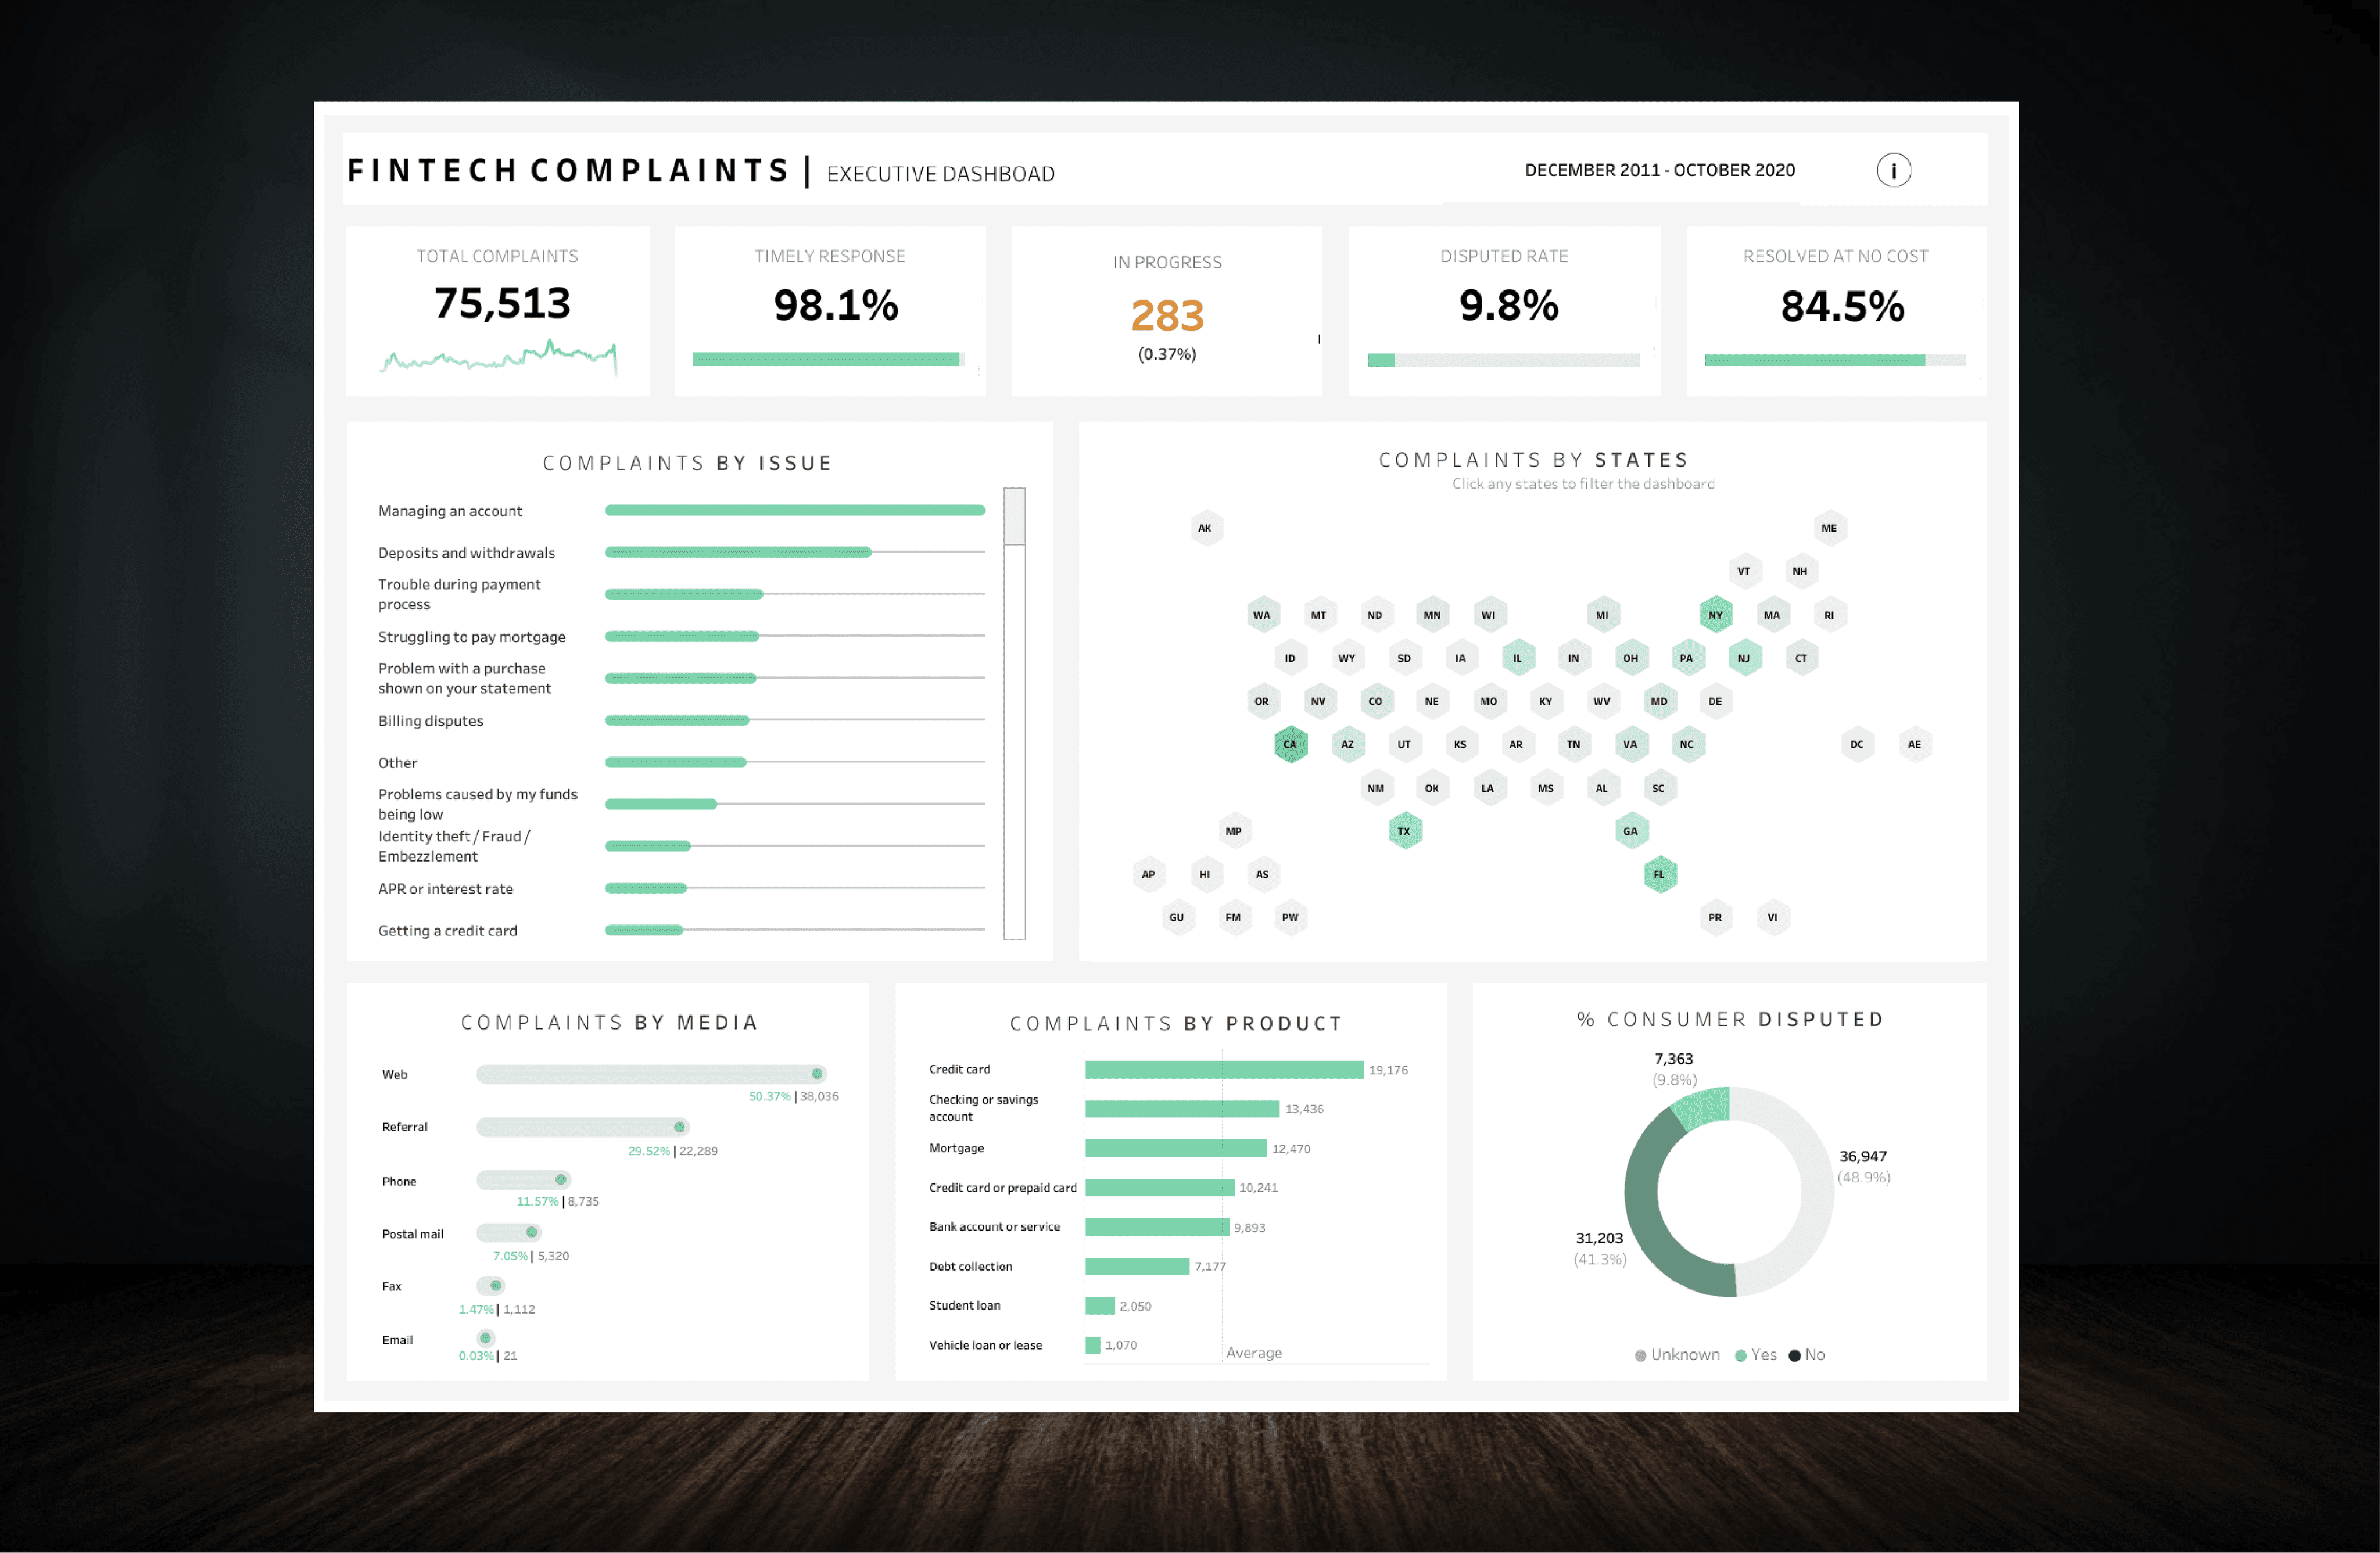
Dynamic Fintech Complaint Dashboard
A dynamic fintech complaints dashboard that provides real-time insights into customer complaints and enhance complaints resolution process.
Dashboard provides real-time updates on KPIs related to complaints that address customer issues promptly, improve customer satisfaction, and reduce dispute rates.
Client
Fintech Company
Role
Tableau Developer
Services
Data Visualization, Dashboard creation
"Client's complaint management process improved through real-time updates vai comprehensive KPI monitoring, and prompt issue resolution. This led to improved customer satisfaction, reduced dispute rates, streamlined complaint resolution"
Waqas Ahmad – Tableau Developer
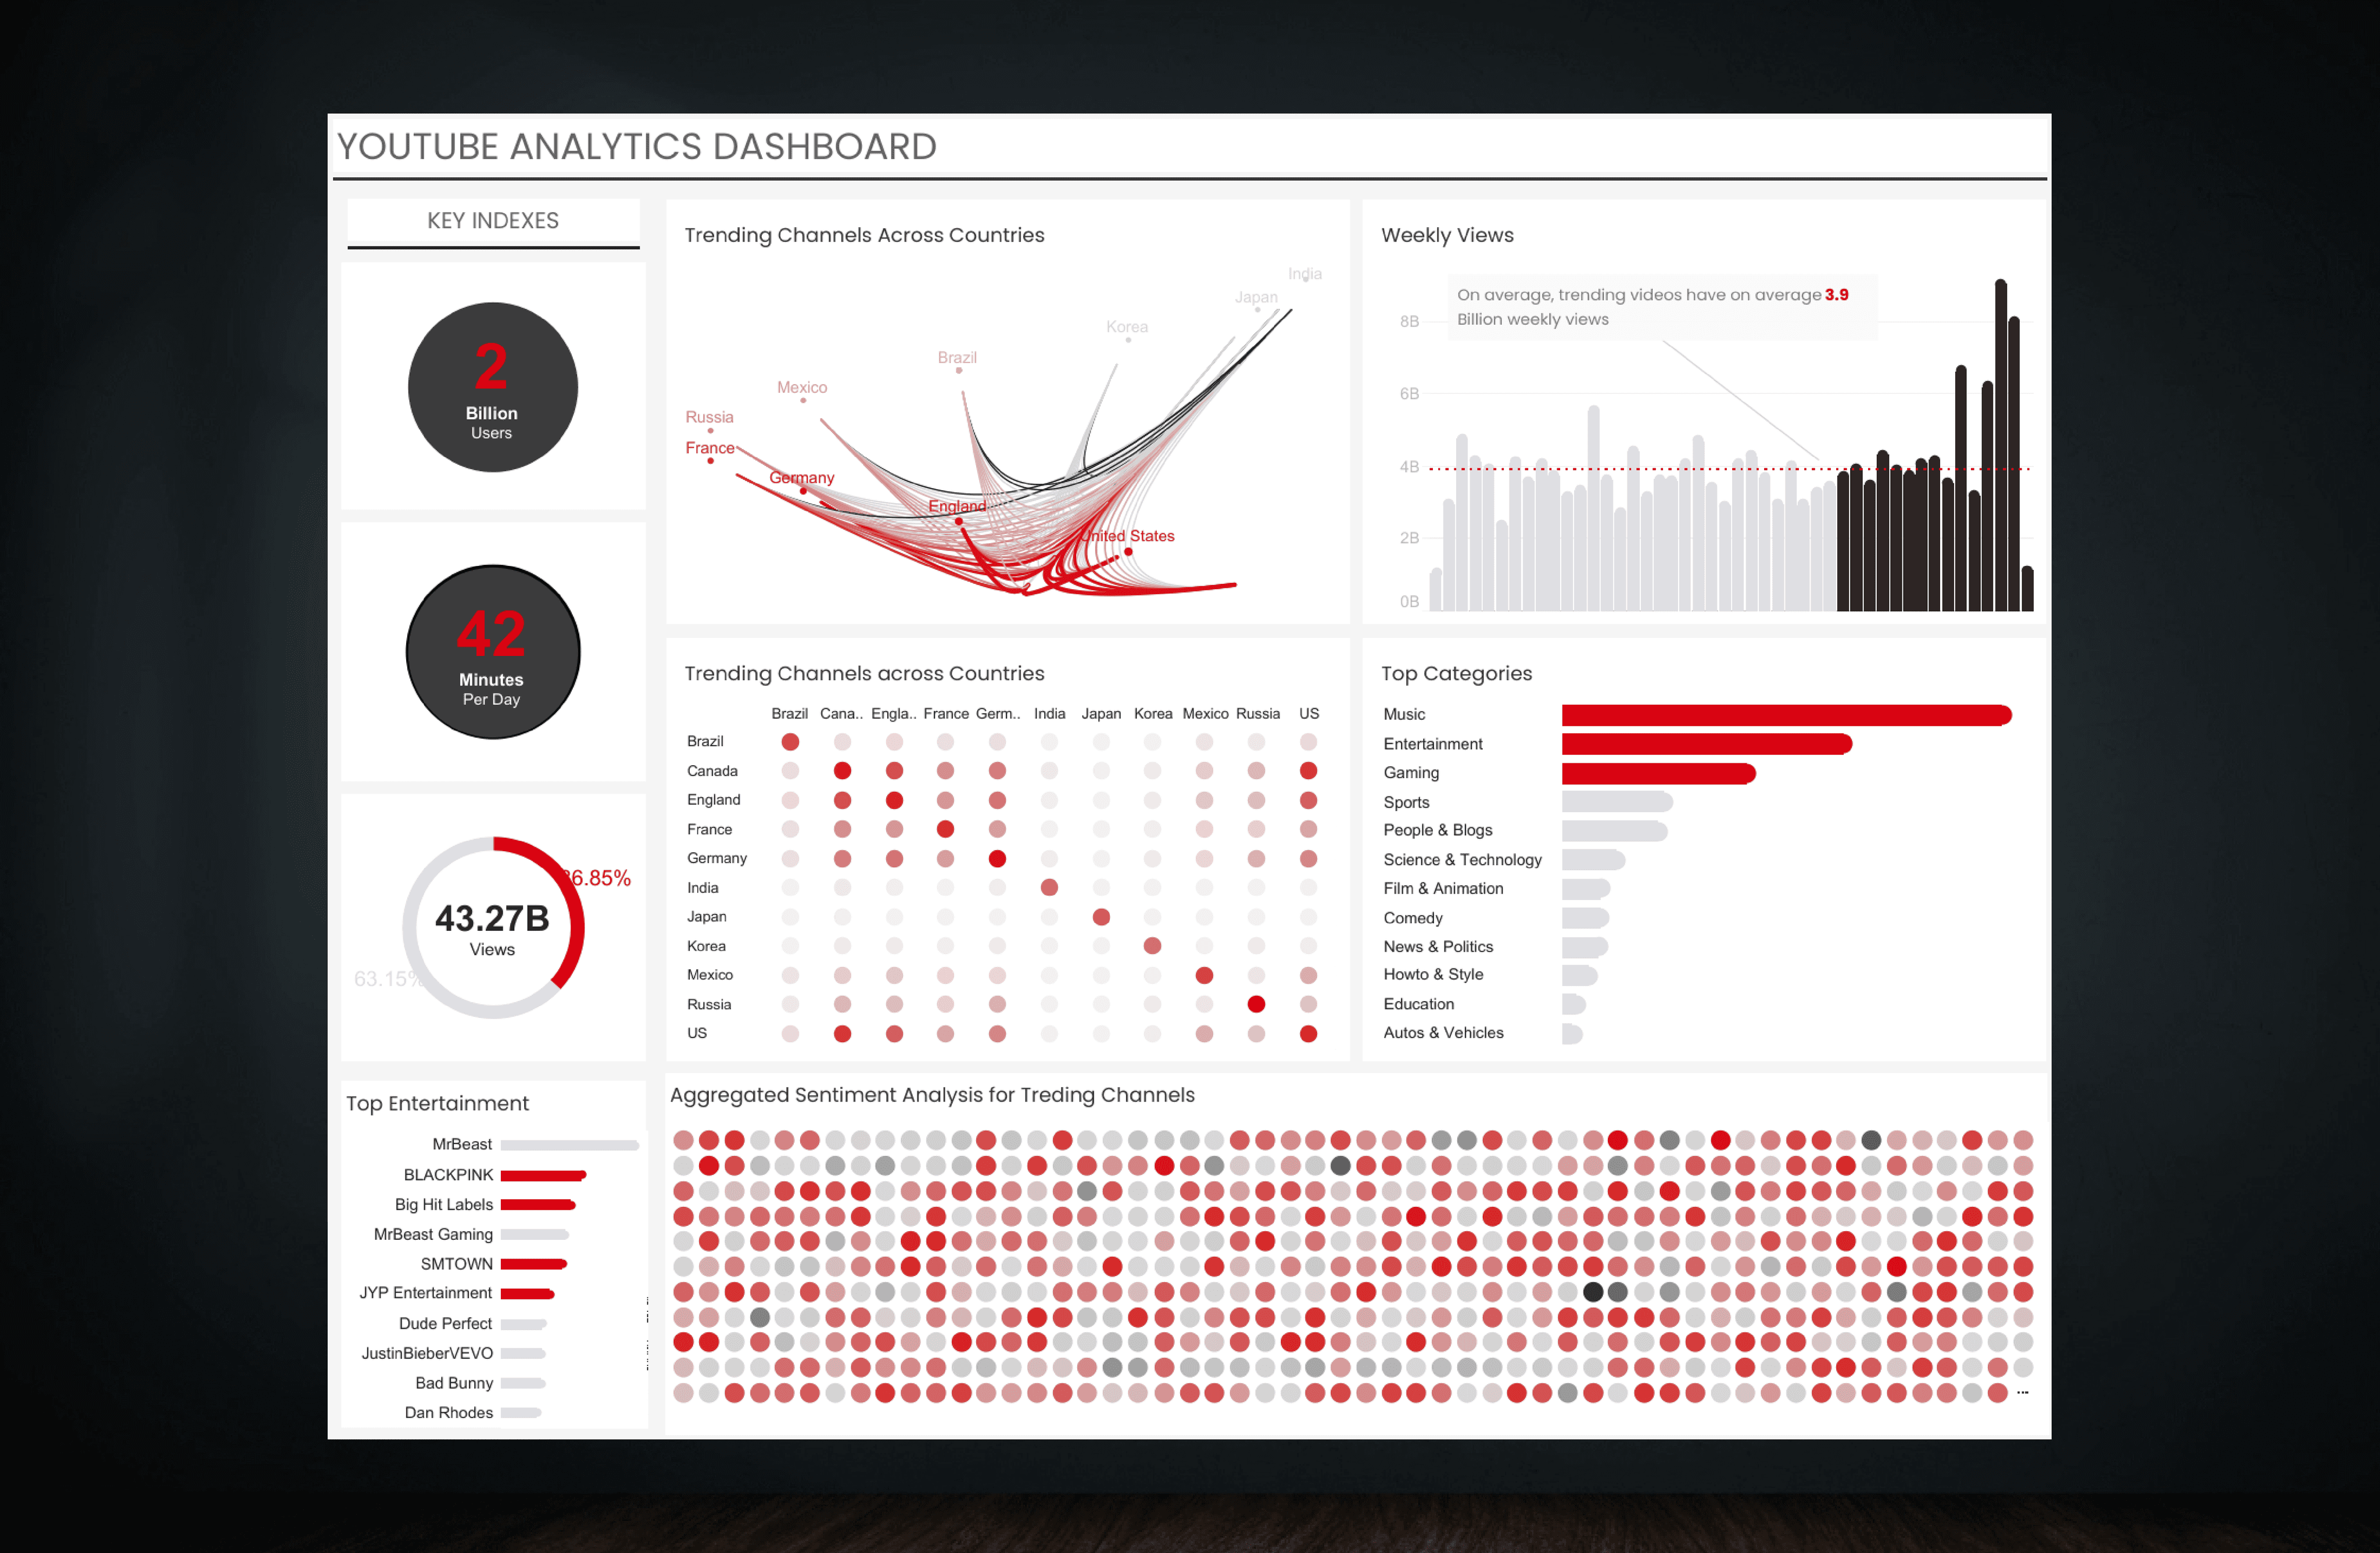
Youtube Trending Vidoes Analytics
Developed a YouTube Data Analytics Dashboard using the Kaggle YouTube Trending Dataset. Dashboard offers insights into the trends and patterns observed in YouTube videos across different countries.
By exploring correlations among trending channels and analyzing user behavior, the dashboard provides valuable information on popular categories, viewership, and sentiment analysis.
Client
Hobby Project
Role
Tableau Developer, Designer
Services
Dashboard Design, BI, Data visualization
"Dashboard provides a valuable tool for analyzing YouTube trends and can be utilized for marketing strategies, content creation decisions, and understanding user behavior on the platform"
Waqas Ahmad – Tableau Developer

NLP - SMS Sentimental Analysis
Successfully created a model that accurately classifies text messages and provides insights into the sentiment present in the messages
This project endeavors to perform sentiment analysis on SMS chat messages by creating a precise text classification model for insights into message sentiments and investigating cross-country sentiment patterns
Project Stack
NLP, EDA, Python, ML
Role
Data Analyst, Data Scientist
Services
EDA, viz, Language processing, Modeling
"Using a sentiment classification model, I assessed sentiments in the NUS SMS Corpus, revealing that 64.3% of messages were negative, and 35.8% were positive. Trinidad and Tobago ranked highest in positivity, while Lebanon scored highest in negativity. This analysis highlights sentiment patterns across countries."
Waqas Ahmad - Data Analyst
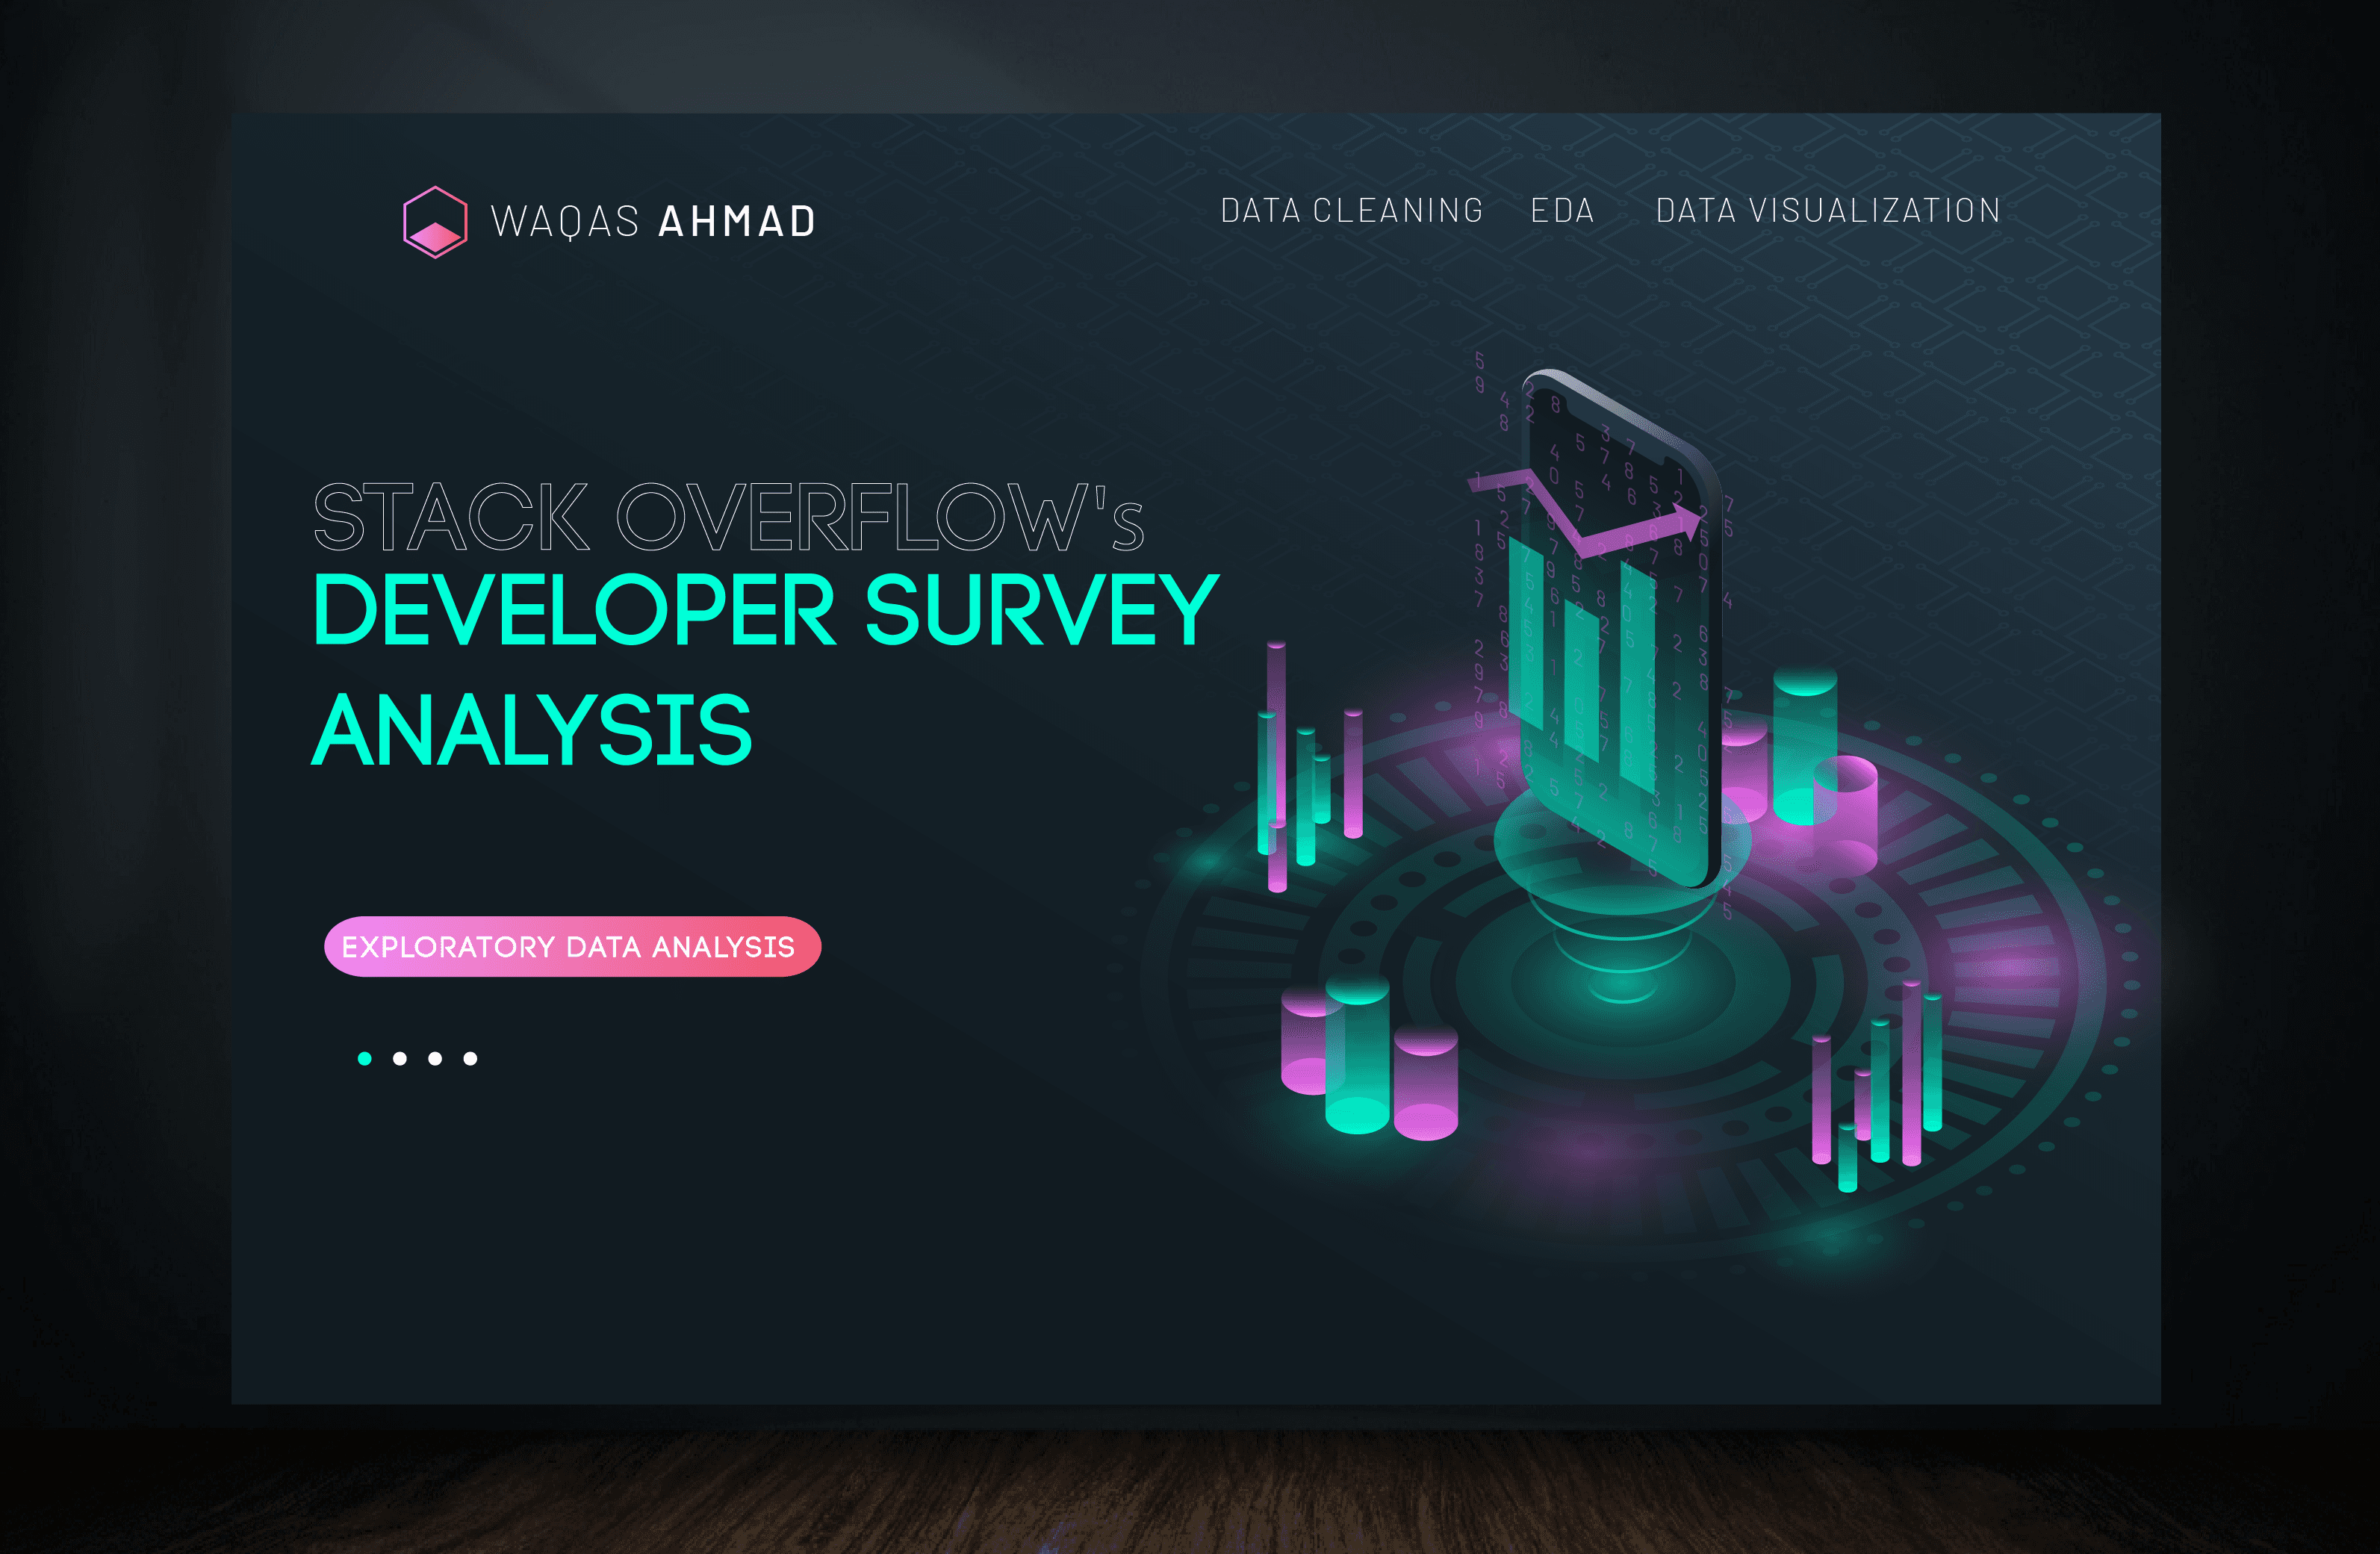
Stack Overflow Case Study
Understanding the proramming community by analyzing responses from the Stack Overflow Annual Developer Survey
Analyzing the 2020 Stack Overflow Developer Survey to understand programmer demographics, education, career paths, language popularity, and age's impact on careers. Providing a comprehensive view with key findings, visuals, and actionable insights.
Project Stack
Python, NumPy, Panda, Matplot, Seaborn
Role
Data Analyst
Services
Cleaning, EDA, Data viz, Data Storytelling
"Stack Overflow Developer Survey analysis revealed the need for more diversity, with a focus on underrepresented groups and non-English-speaking countries. It underscores the flexibility of educational backgrounds, highlights the popularity of Python, and shows that age is not a barrier to entering the programming field"
Waqas Ahmad – Data Analyst
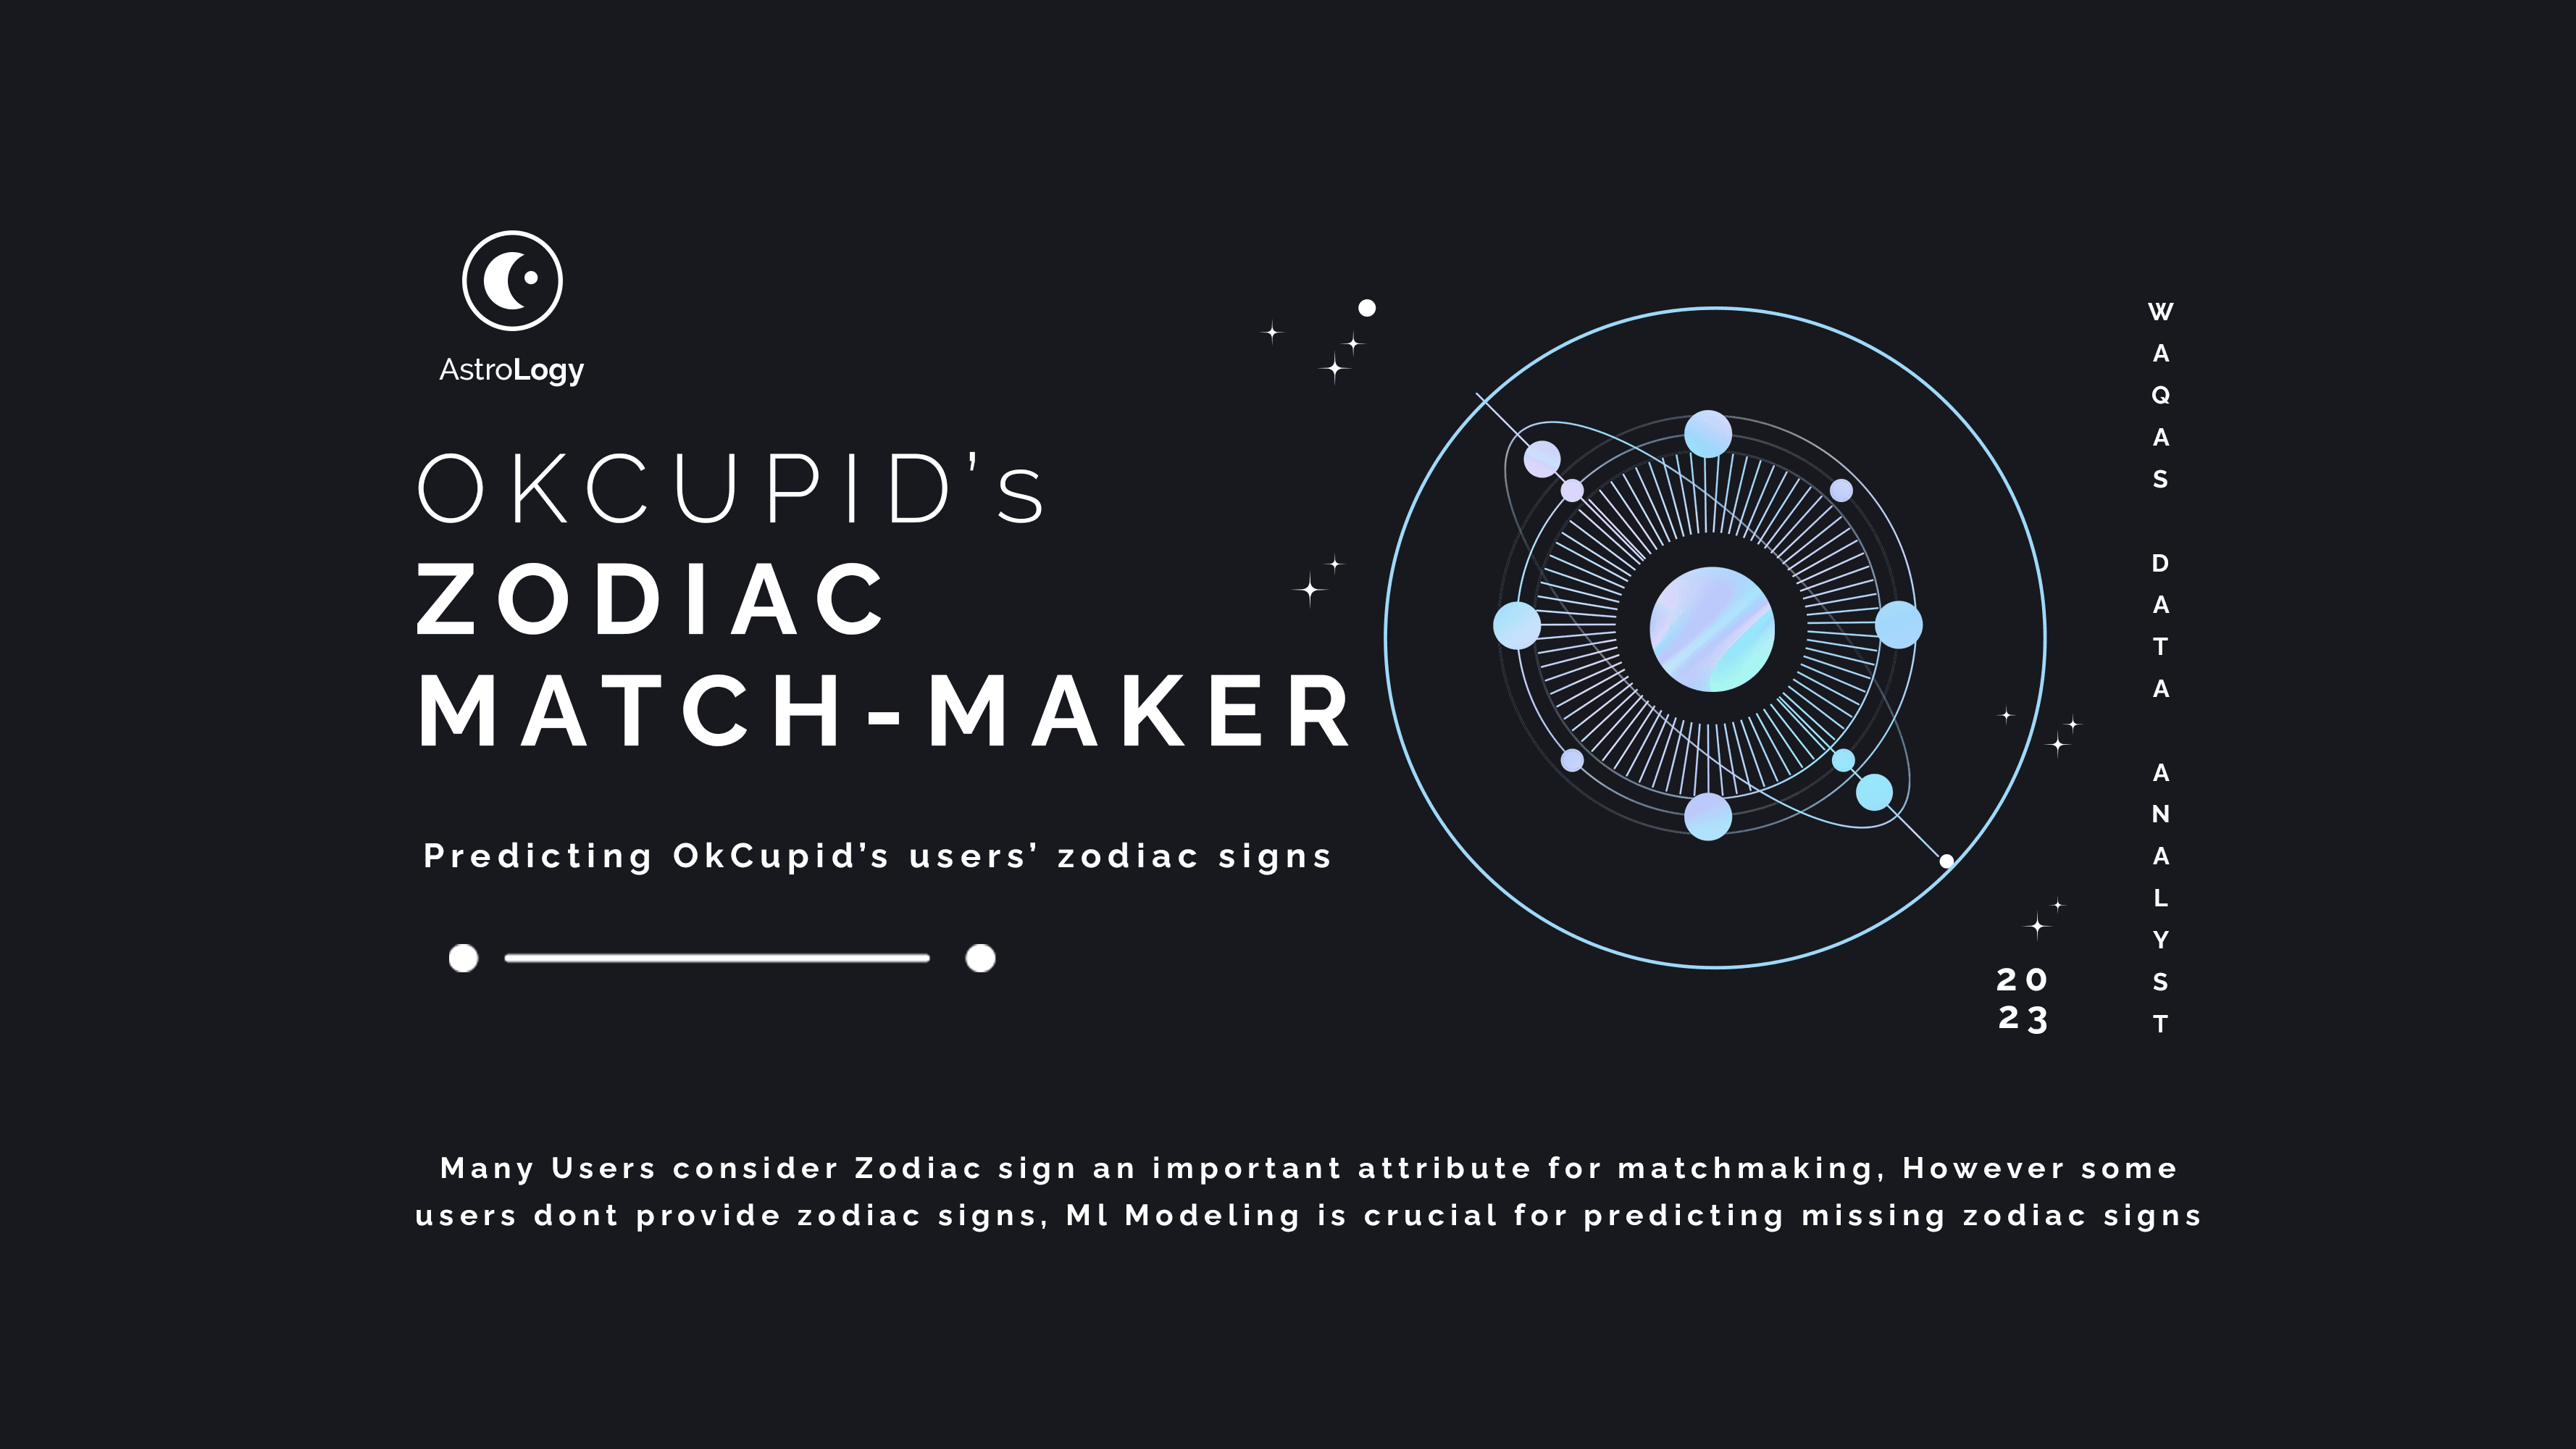
Zodiac Matchmaker - OkCupid's Data Dive
Successfully explored OkCupid's users data and predicted their astrological signs based on the information contained in their profiles by building ML Model
This project dives into OKCupid's online dating data, aiming to predict users' astrological signs from their profiles. Given the importance of astrology in matchmaking, our goal is to enhance user experiences and assist OkCupid in predicting signs for users who haven't provided their zodiac signs.
Project Stack
Python, EDA, Data Viz, ML
Role
Data Analyst, Data Scientist
Services
EDA. Data Viz, ML Modeling
Our project aimed to predict astrological signs, crucial for matchmaking on OkCupid. However, the model's performance was akin to random guessing, prompting the need for further refinements, additional data, or alternative models to improve predictive accuracy in future iterations.
Waqas Ahmad – Data Analyst
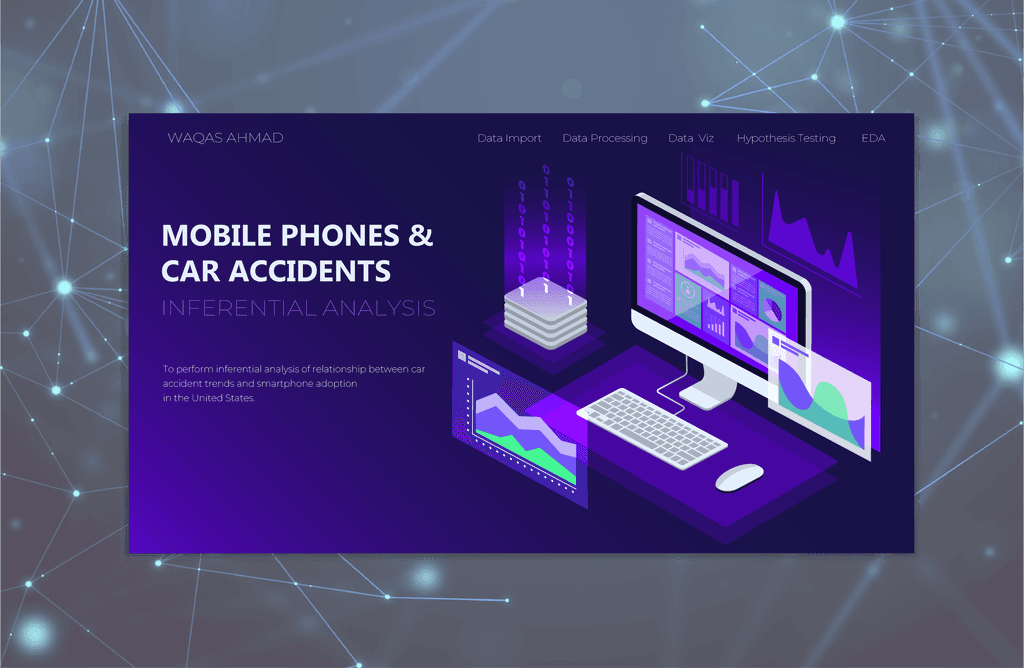
Inferential Analysis - Mobile Phones & Car Accidents
Conducting an inferential analysis to determine whether there is a statistically significant link between smartphone usage and the observed increase in the number of traffic accidents in the United States.
Relationship between car accident trends and smartphone adoption in the United States were explored with focus on the period surrounding the introduction of smartphones in 2011. Project employs statistical methods, visualizations, and hypothesis testing to evaluate the impact of smartphone adoption on accident rates.
Project Stack
Python, NumPy, Pandas, Matplot, Seaborn
Role
Data Analyst
Services
EDA, Data Viz, Inferential storytelling
"Seasonal factors significantly affect accident rates, particularly in Fall and Winter, while it remains inconclusive whether smartphones alone have substantially impacted road safety. The study underscores the complex web of variables, including weather and societal factors, and emphasizes the need for ongoing research to understand the evolving influence of smartphone technology on road safety"
Waqas Ahmad – Data Analyst
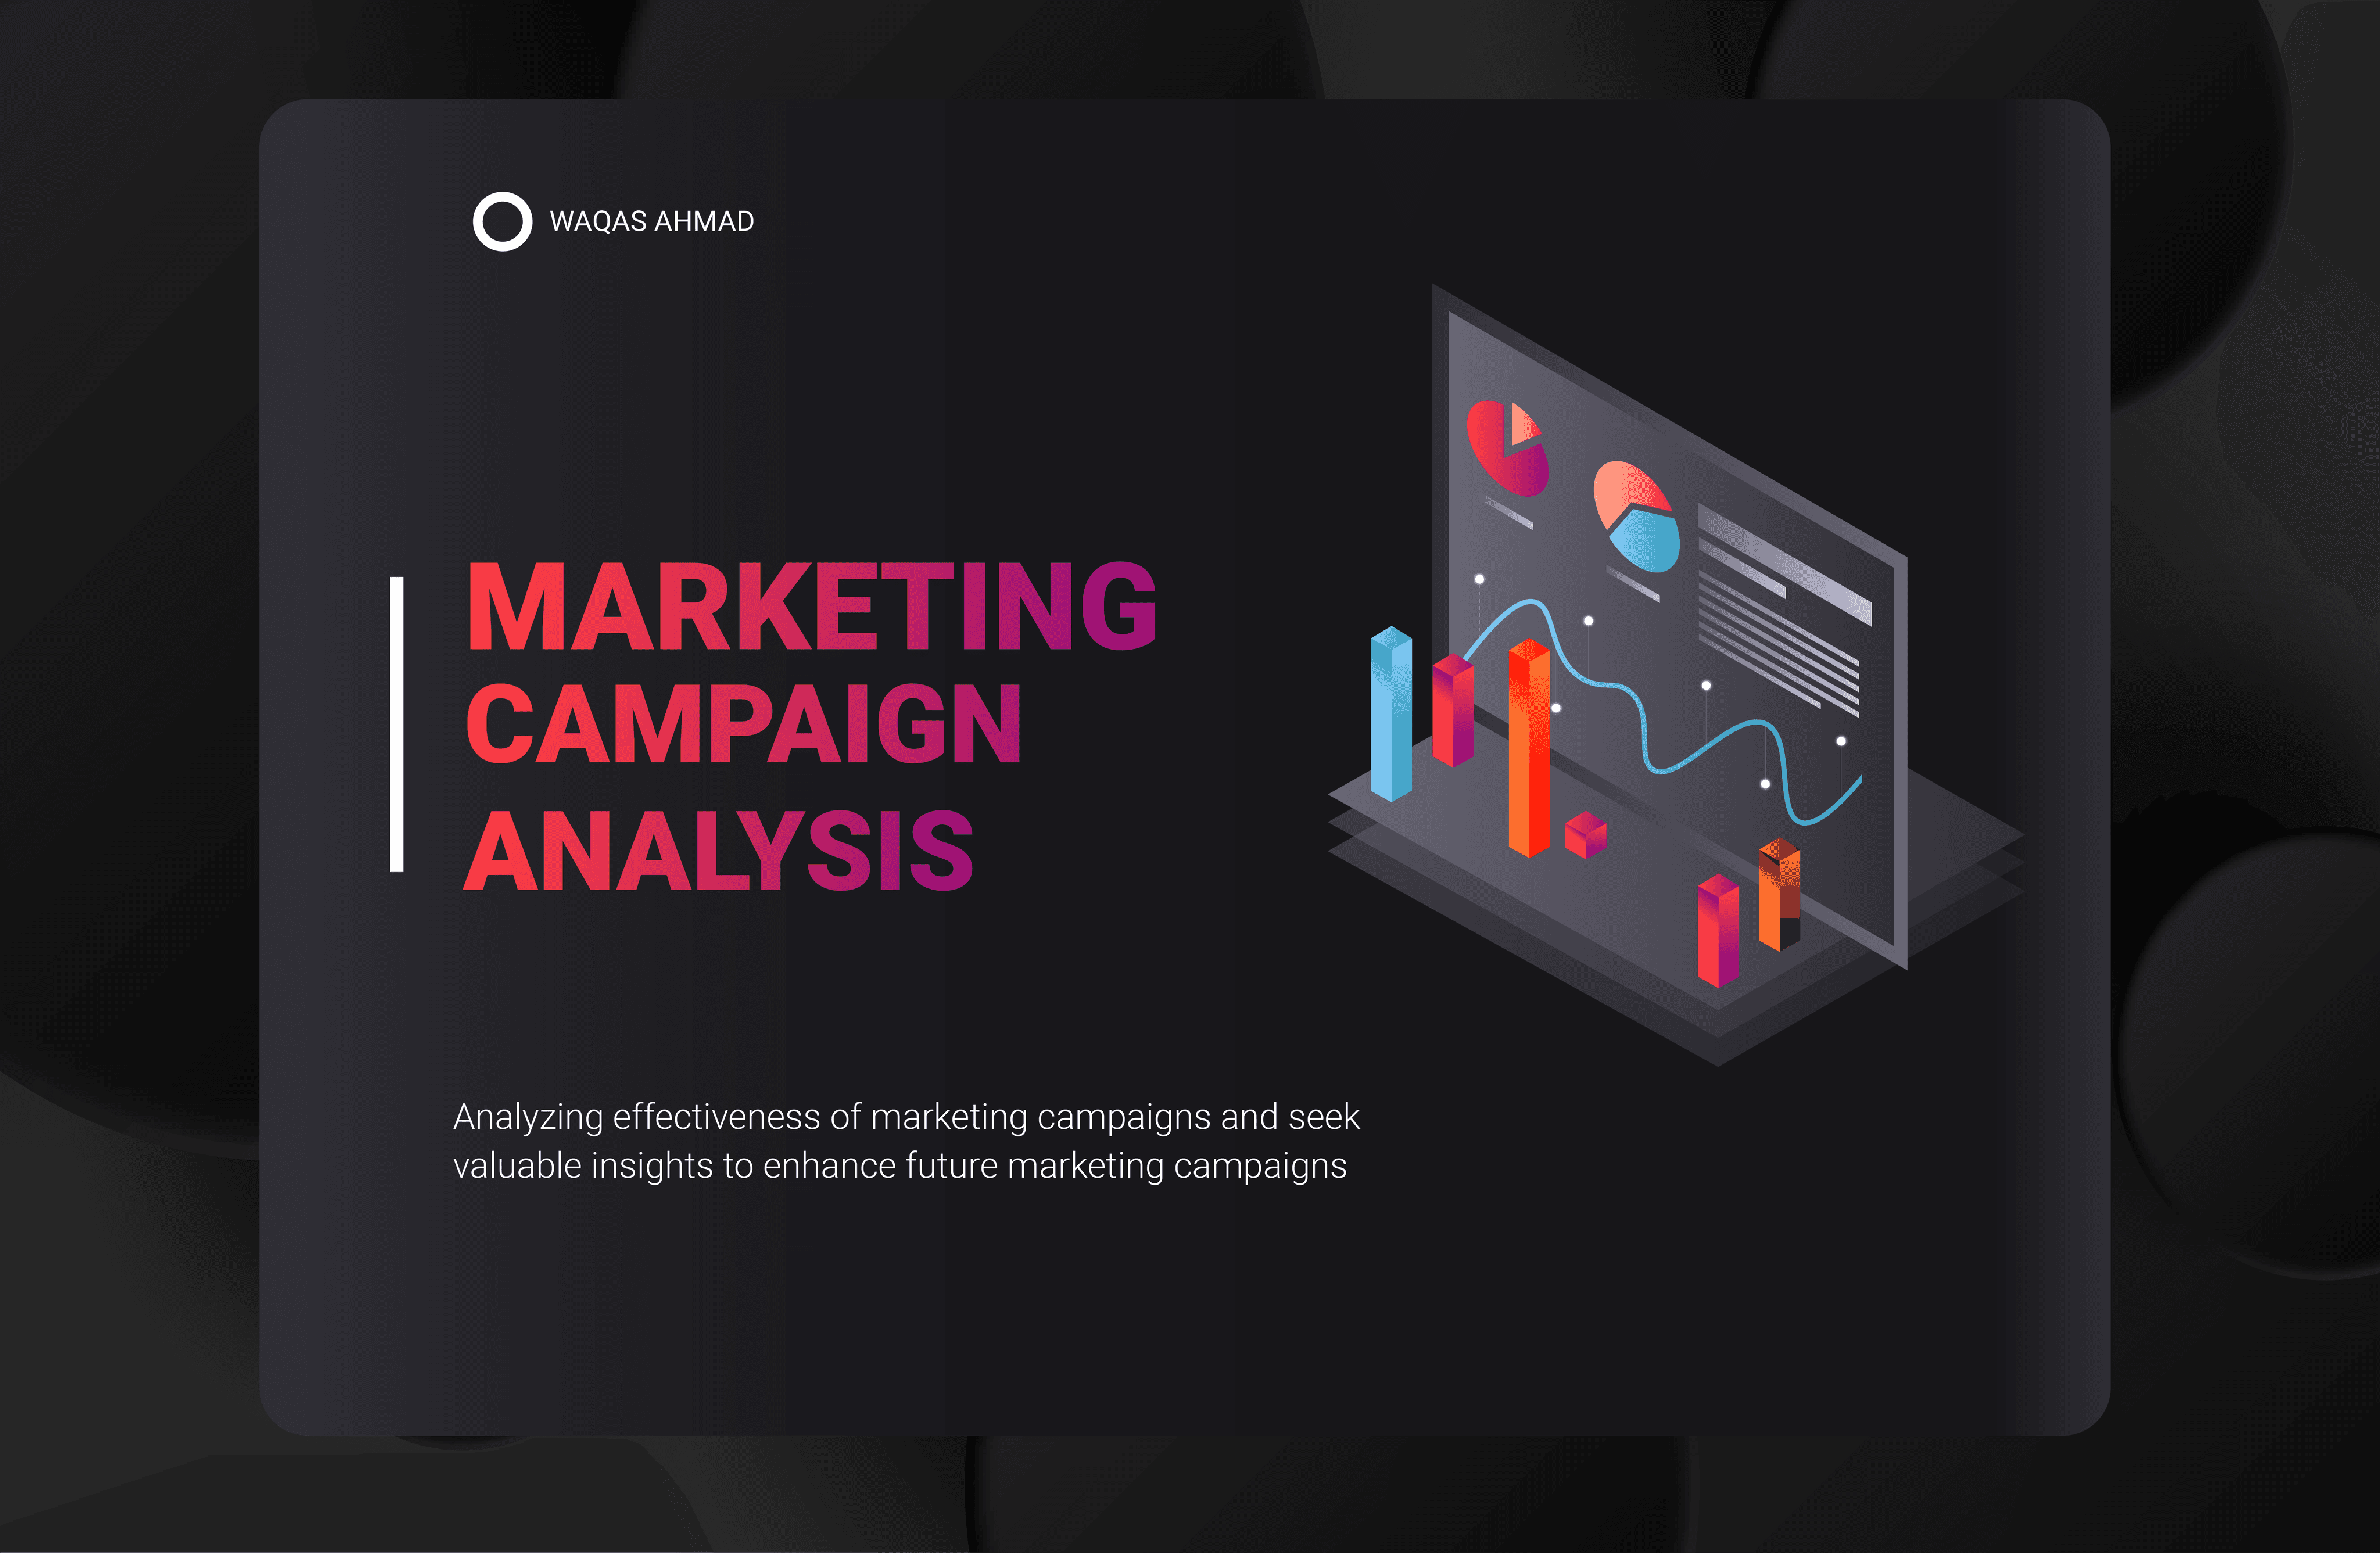
Marketing Campaign Analysis
Gourmet Grocers, a culinary leader, is analyzing marketing campaign performance to elevate profits. Their wide range of gourmet products reaches consumers through multiple channels. The company aims to optimize future campaigns using valuable insights
My objective is to optimize direct marketing initiatives and identify high-value customer segments, by acquainting with and cleaning marketing data, formulating analysis questions, and deriving insights from data patterns, to enhance profitability
Project Stack
Python, EDA, Data Visualization
Role
Data Analyst
Services
Data Exploration, Visualisation
"In this project income emerged as the primary driver of customer purchase behavior, with higher-income groups dominating certain product categories. Tailoring marketing to specific age groups, especially the 71+ demographic, and expanding online and in-store options presents opportunities for growth. These insights inform strategies to optimize pricing, customer engagement, and market reach."
Michael Scott – Fictional Character
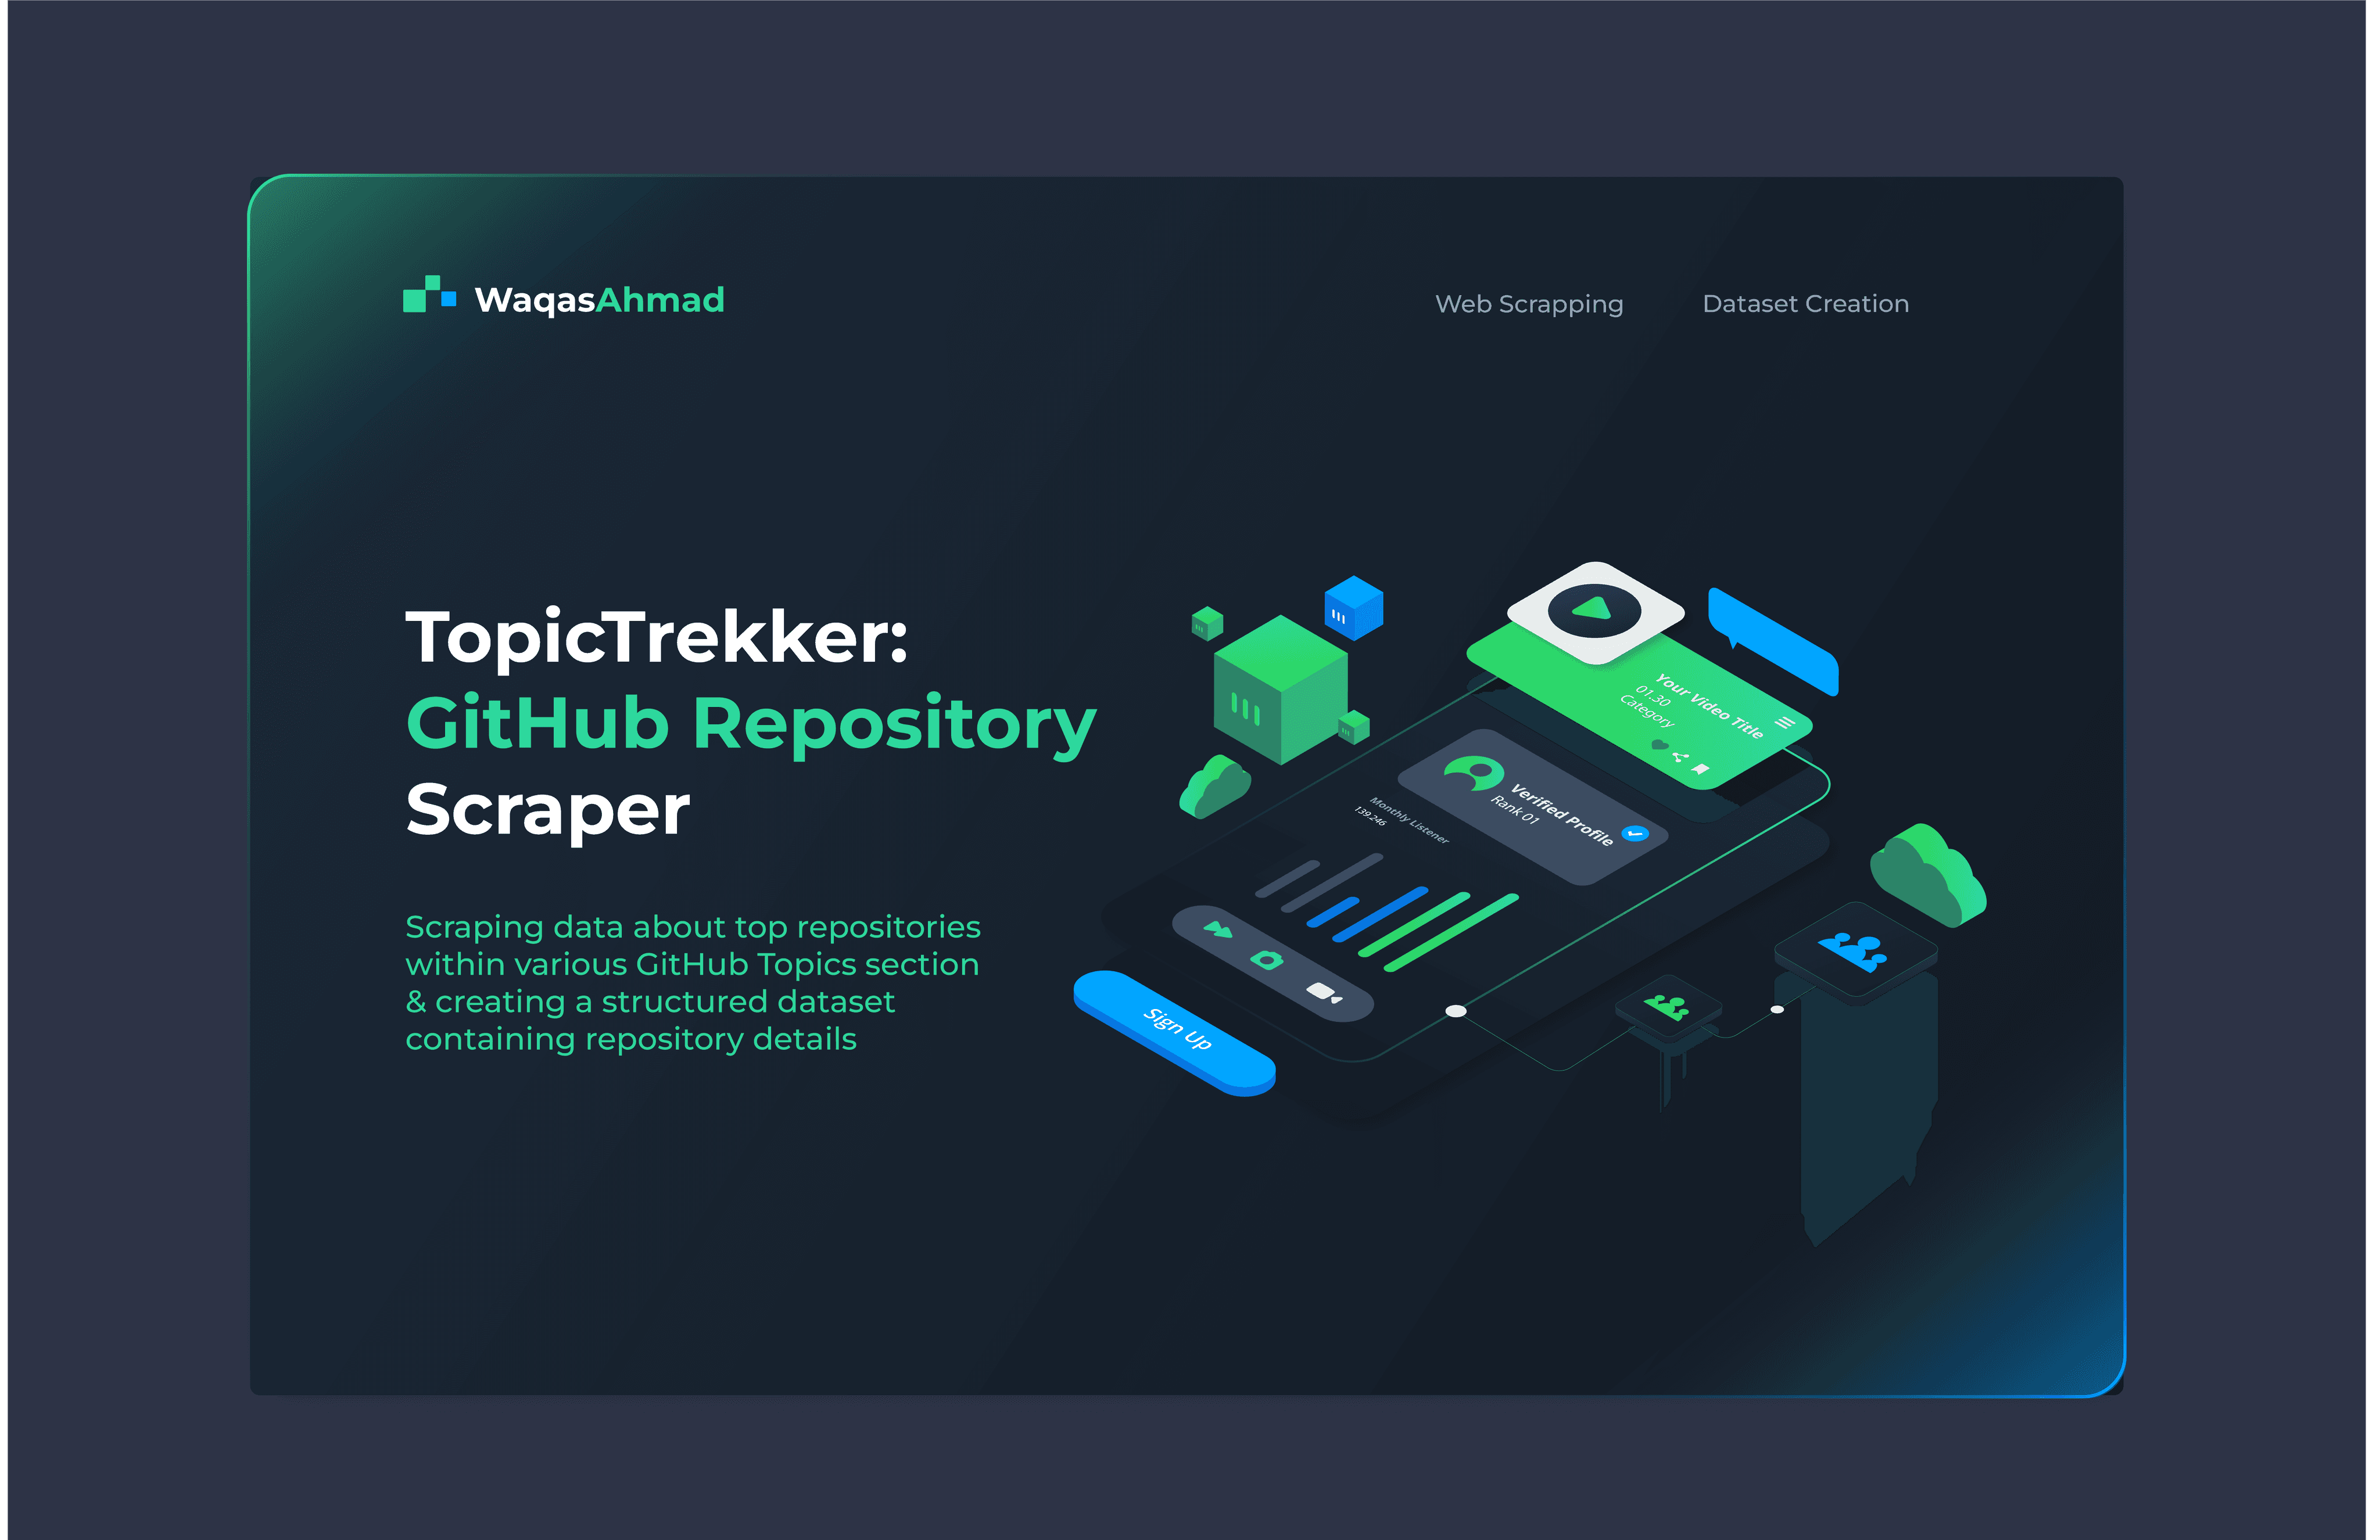
TopicTrekker: GitHub Repository Scraper
Successfully scraped data from GitHub, a renowned platform for developers, and extracted information about the top repositories within various GitHub topics.
Our goal is to scrap data about the top repositories within various GitHub Topics section and create a structured dataset containing repository details, such as repository name, owner username, star count, and repository URL etc.
Project Satck
Python, BeautifulSoup, Pandas, Numpy
Role
Data Analyst
Services
Web Scrappin, Analysis, Dataset Creation
"Extracted valuable data from dynamic websites. We organized this data into structured datasets and gained insights into user engagement on GitHub. Detailed analysis and code can be accessed in a Jupyter Notebook"
Waqas Ahmad – Data Analyst
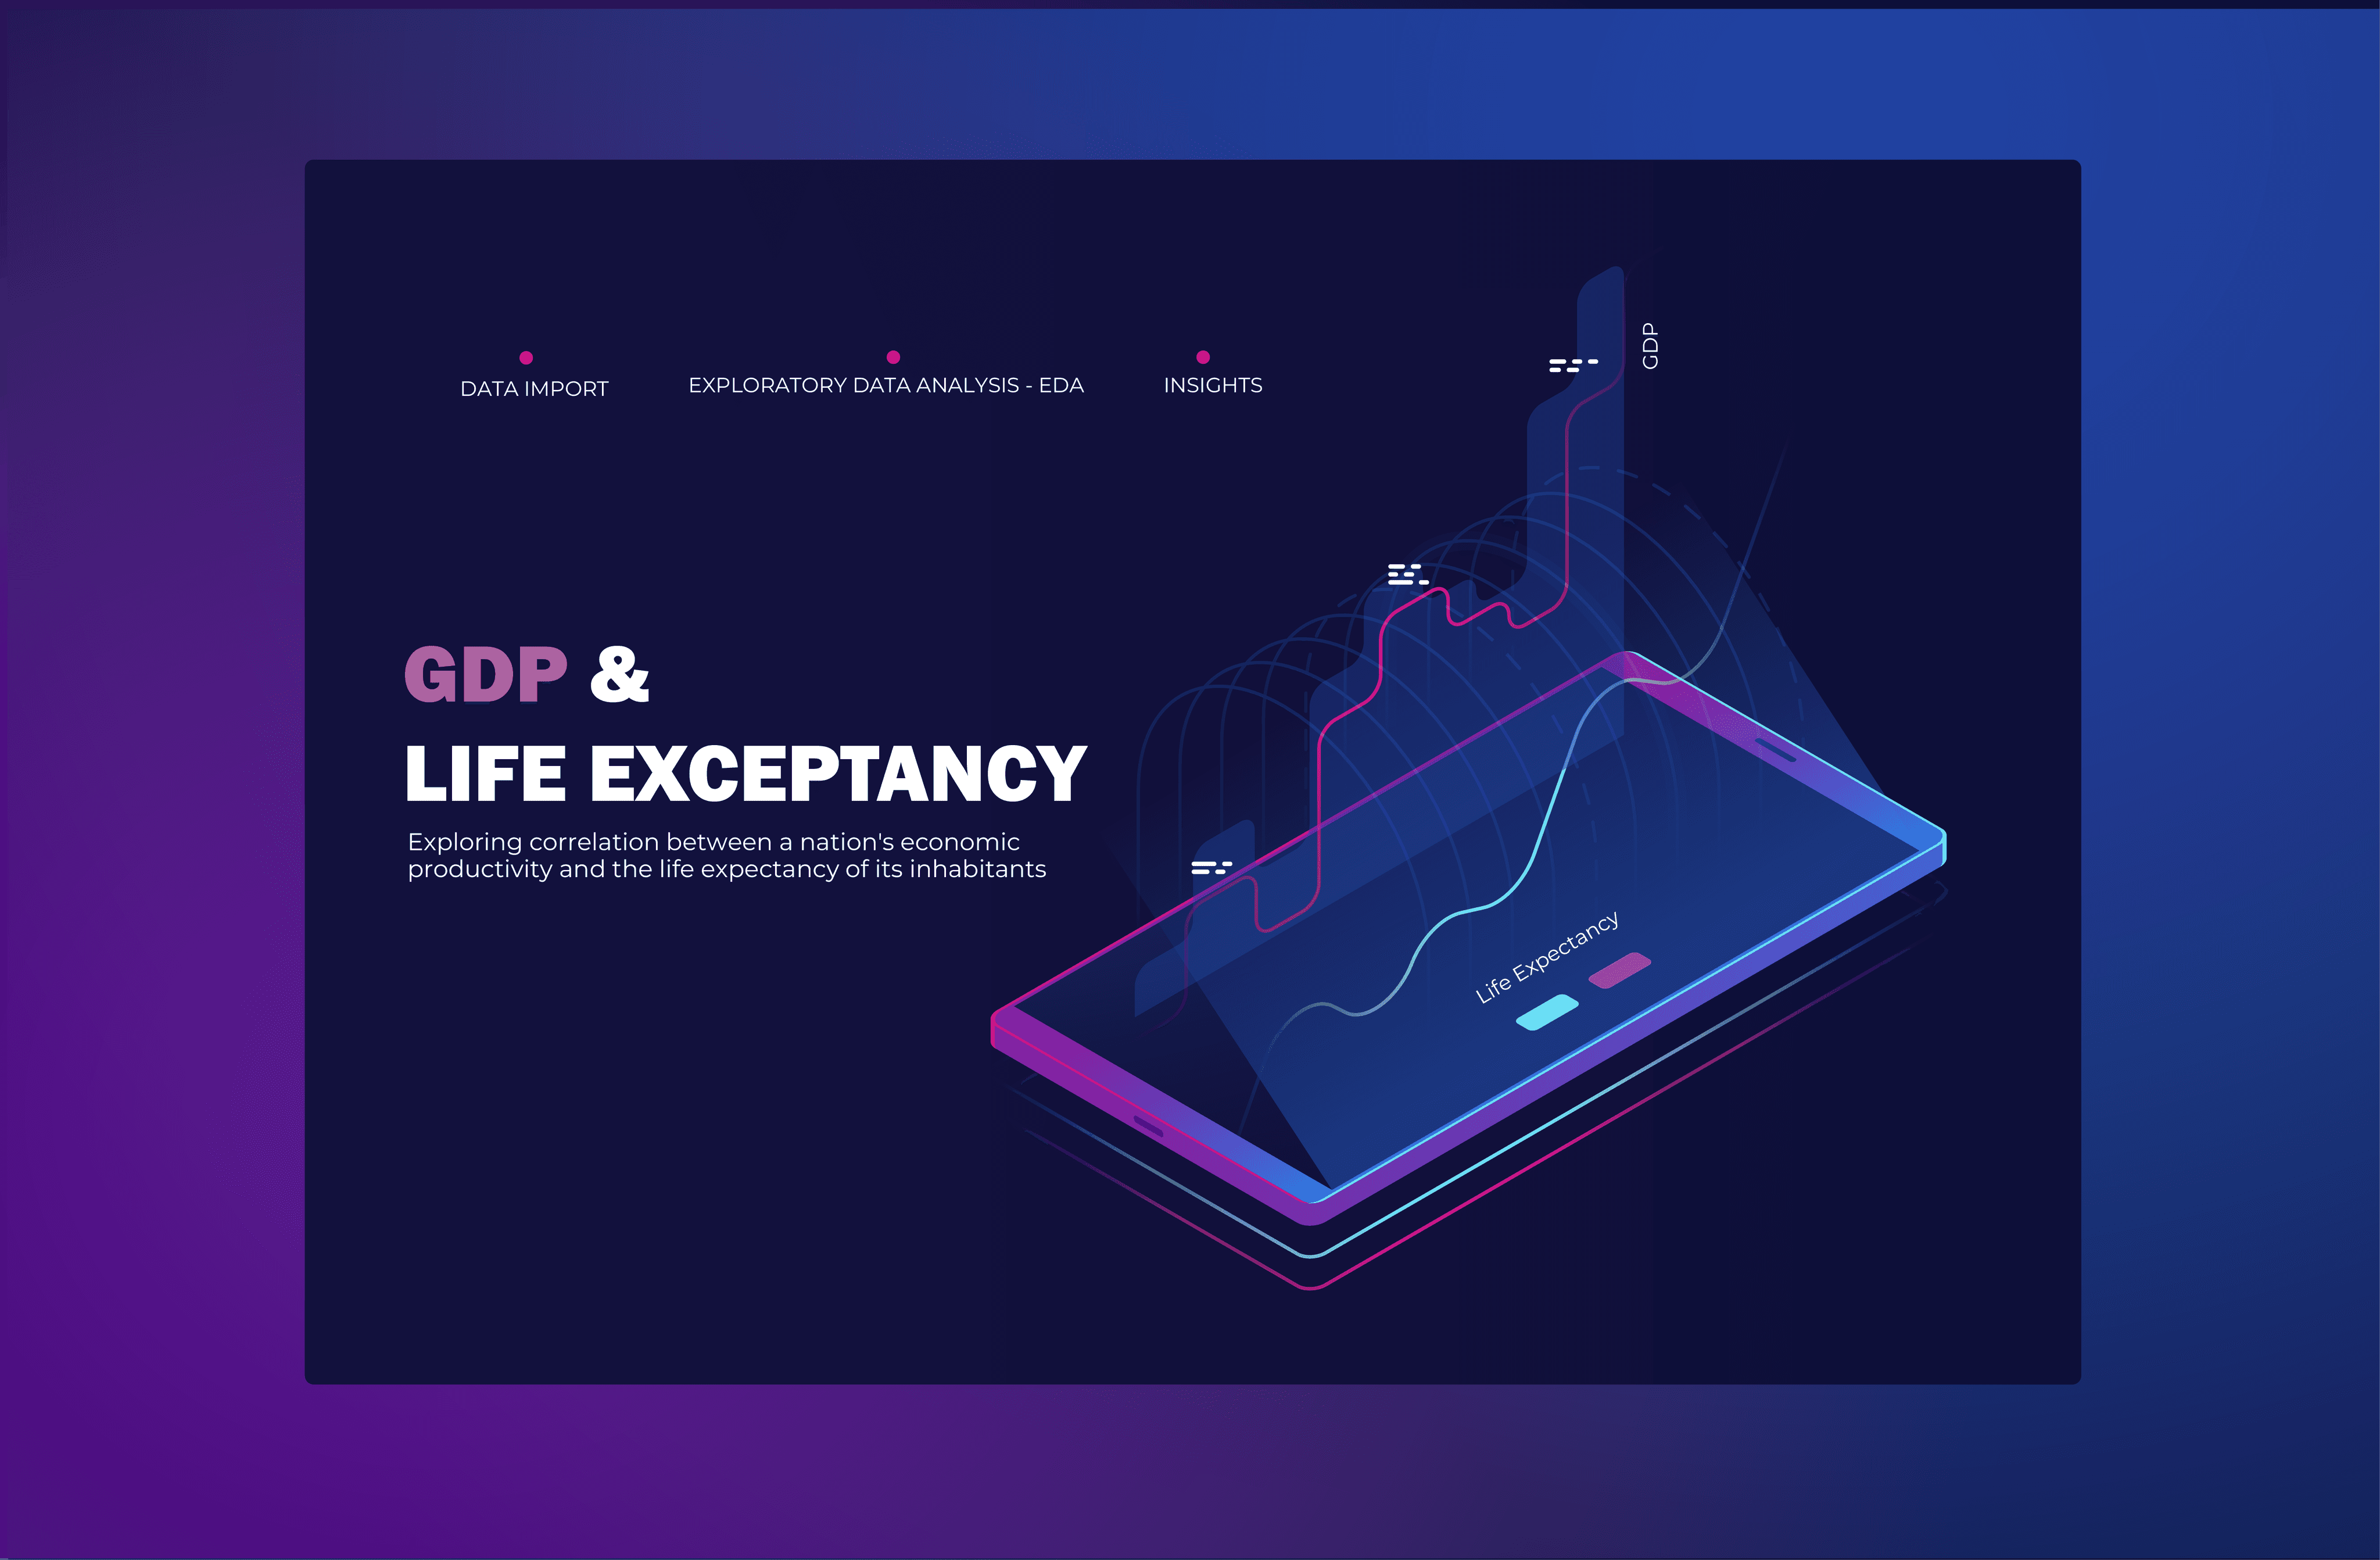
Life Expectancy & GDP
This project explores the correlation between a nation's GDP and the life expectancy of its citizens. The analysis includes data from six nations and covers the years 2000 to 2015.
This project analyzed life expectancy and GDP in six nations, revealing increasing life expectancy, significant GDP growth in China, and a positive correlation between GDP and life expectancy. The average life expectancy ranged from the mid to high 70s, except for Zimbabwe at 50, with a left-skewed distribution.
Project Stack
Numpy, Pandas, Matplot, Seaborn
Role
Data Analyst
Services
EDA, Data Viz, Data Cleaning, Data Processing
"In brief, life expectancy improved, notably in Zimbabwe. GDP grew in all nations, led by China. A positive GDP-life expectancy correlation exists, with an average life expectancy in the mid to high 70s, except in Zimbabwe (50), and a left-skewed distribution"
Waqas Ahmad – Data Analyst
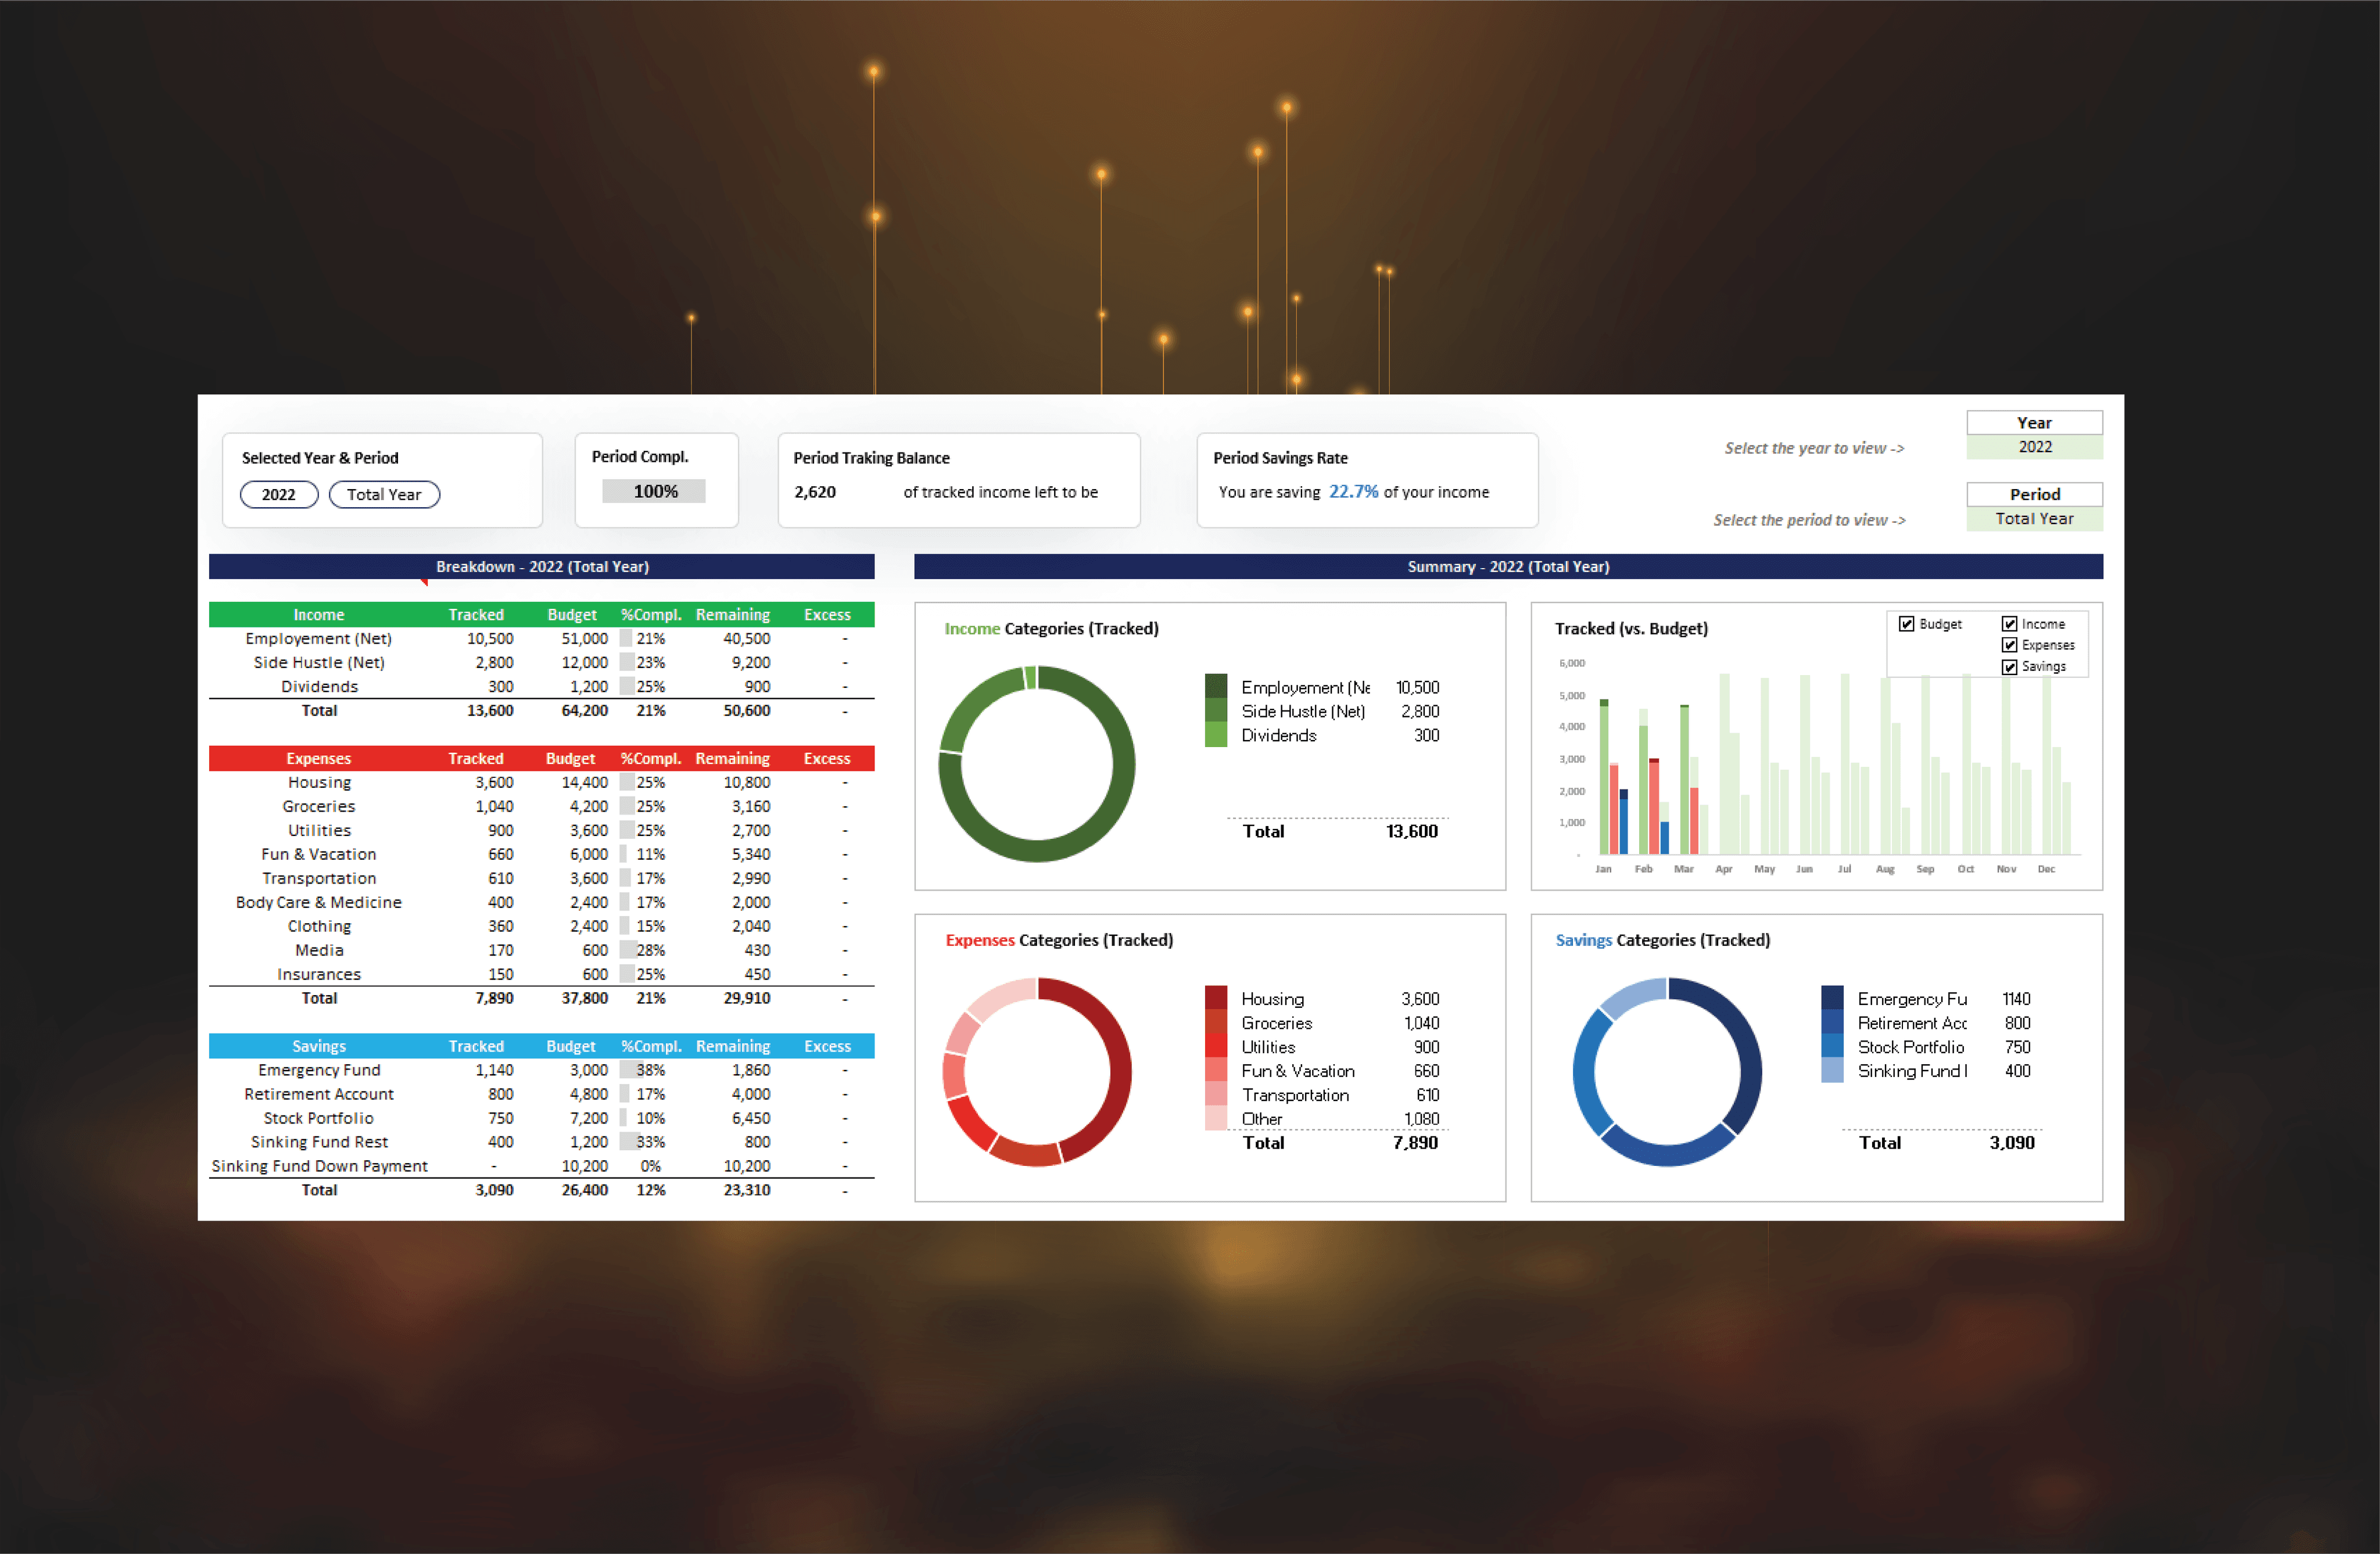
Budget Excel Dashboard
A personal finance dashboard, all-in-one cockpit for financial clarity. It breaks down your income, expenses, and goals into colorful visuals, tracks progress, connects to accounts, and provides actionable insights to empower your financial journey.
Successfully developed this dashboard for a client to tracks income in colorful graphs, monitor debt progress with interactive charts, and keep tabs on spending across categories, all in one visually stunning hub.
Client
Financial Advisor
Role
Excel Dashboard Developer
Services
Data Cleaning, Data Manipulation, Data scrapping, Data Visualizations
"Working with Jessie Mendez has been an absolute game-changer for our business. We couldn't be happier with the results!"
Waqas Ahmad –Business Intelliegence Analyst
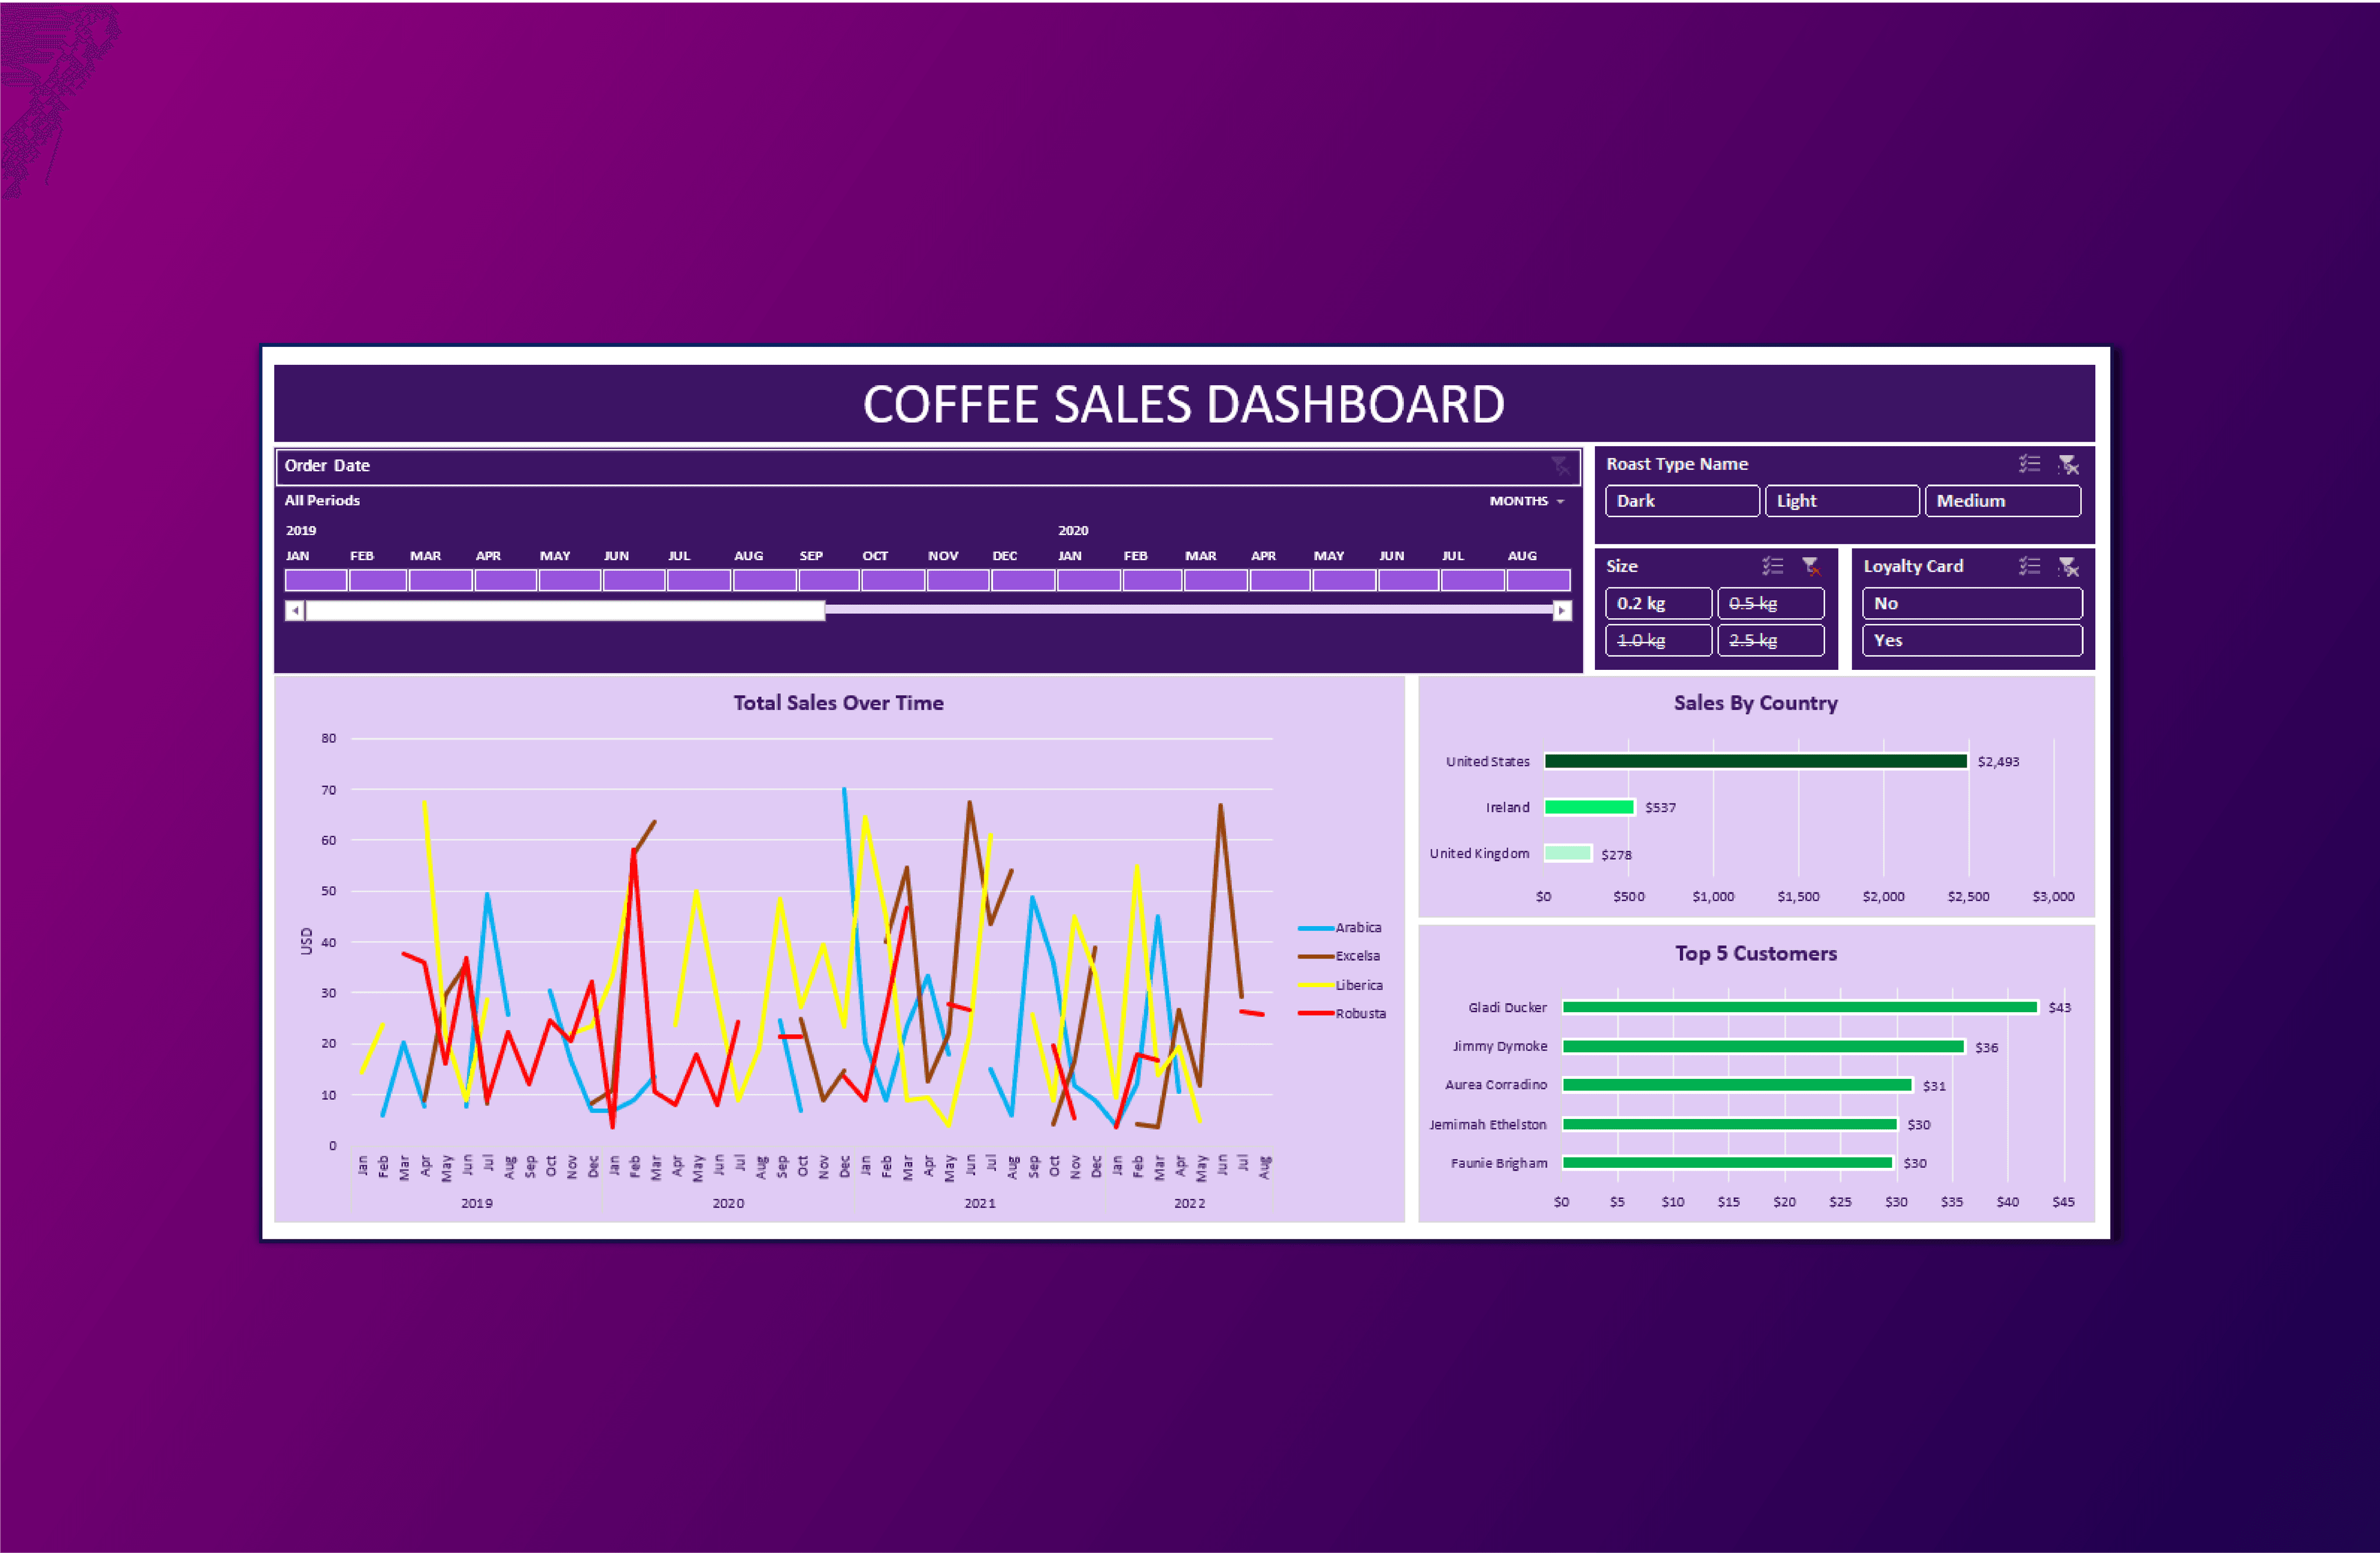
Coffee Sales Dashboard - Excel
The Coffee Sales Dashboard is designed to provide comprehensive insights into coffee sales data, enabling users to make data-driven decisions regarding coffee products.
Dashboard offers filtering options and graphical representations to understand sales trends, coffee types, customer preferences, and regional performance.
Client
Coffee Shop
Role
Dashboard Developer, BI, Data Visualization,
Project Stack
Microsoft Excel
"Coffee Sales Dashboard simplifies data analysis, making it easier to track sales trends, understand customer preferences, and evaluate the performance of different coffee types and sizes"
Waqas Ahmad – Data Analyst
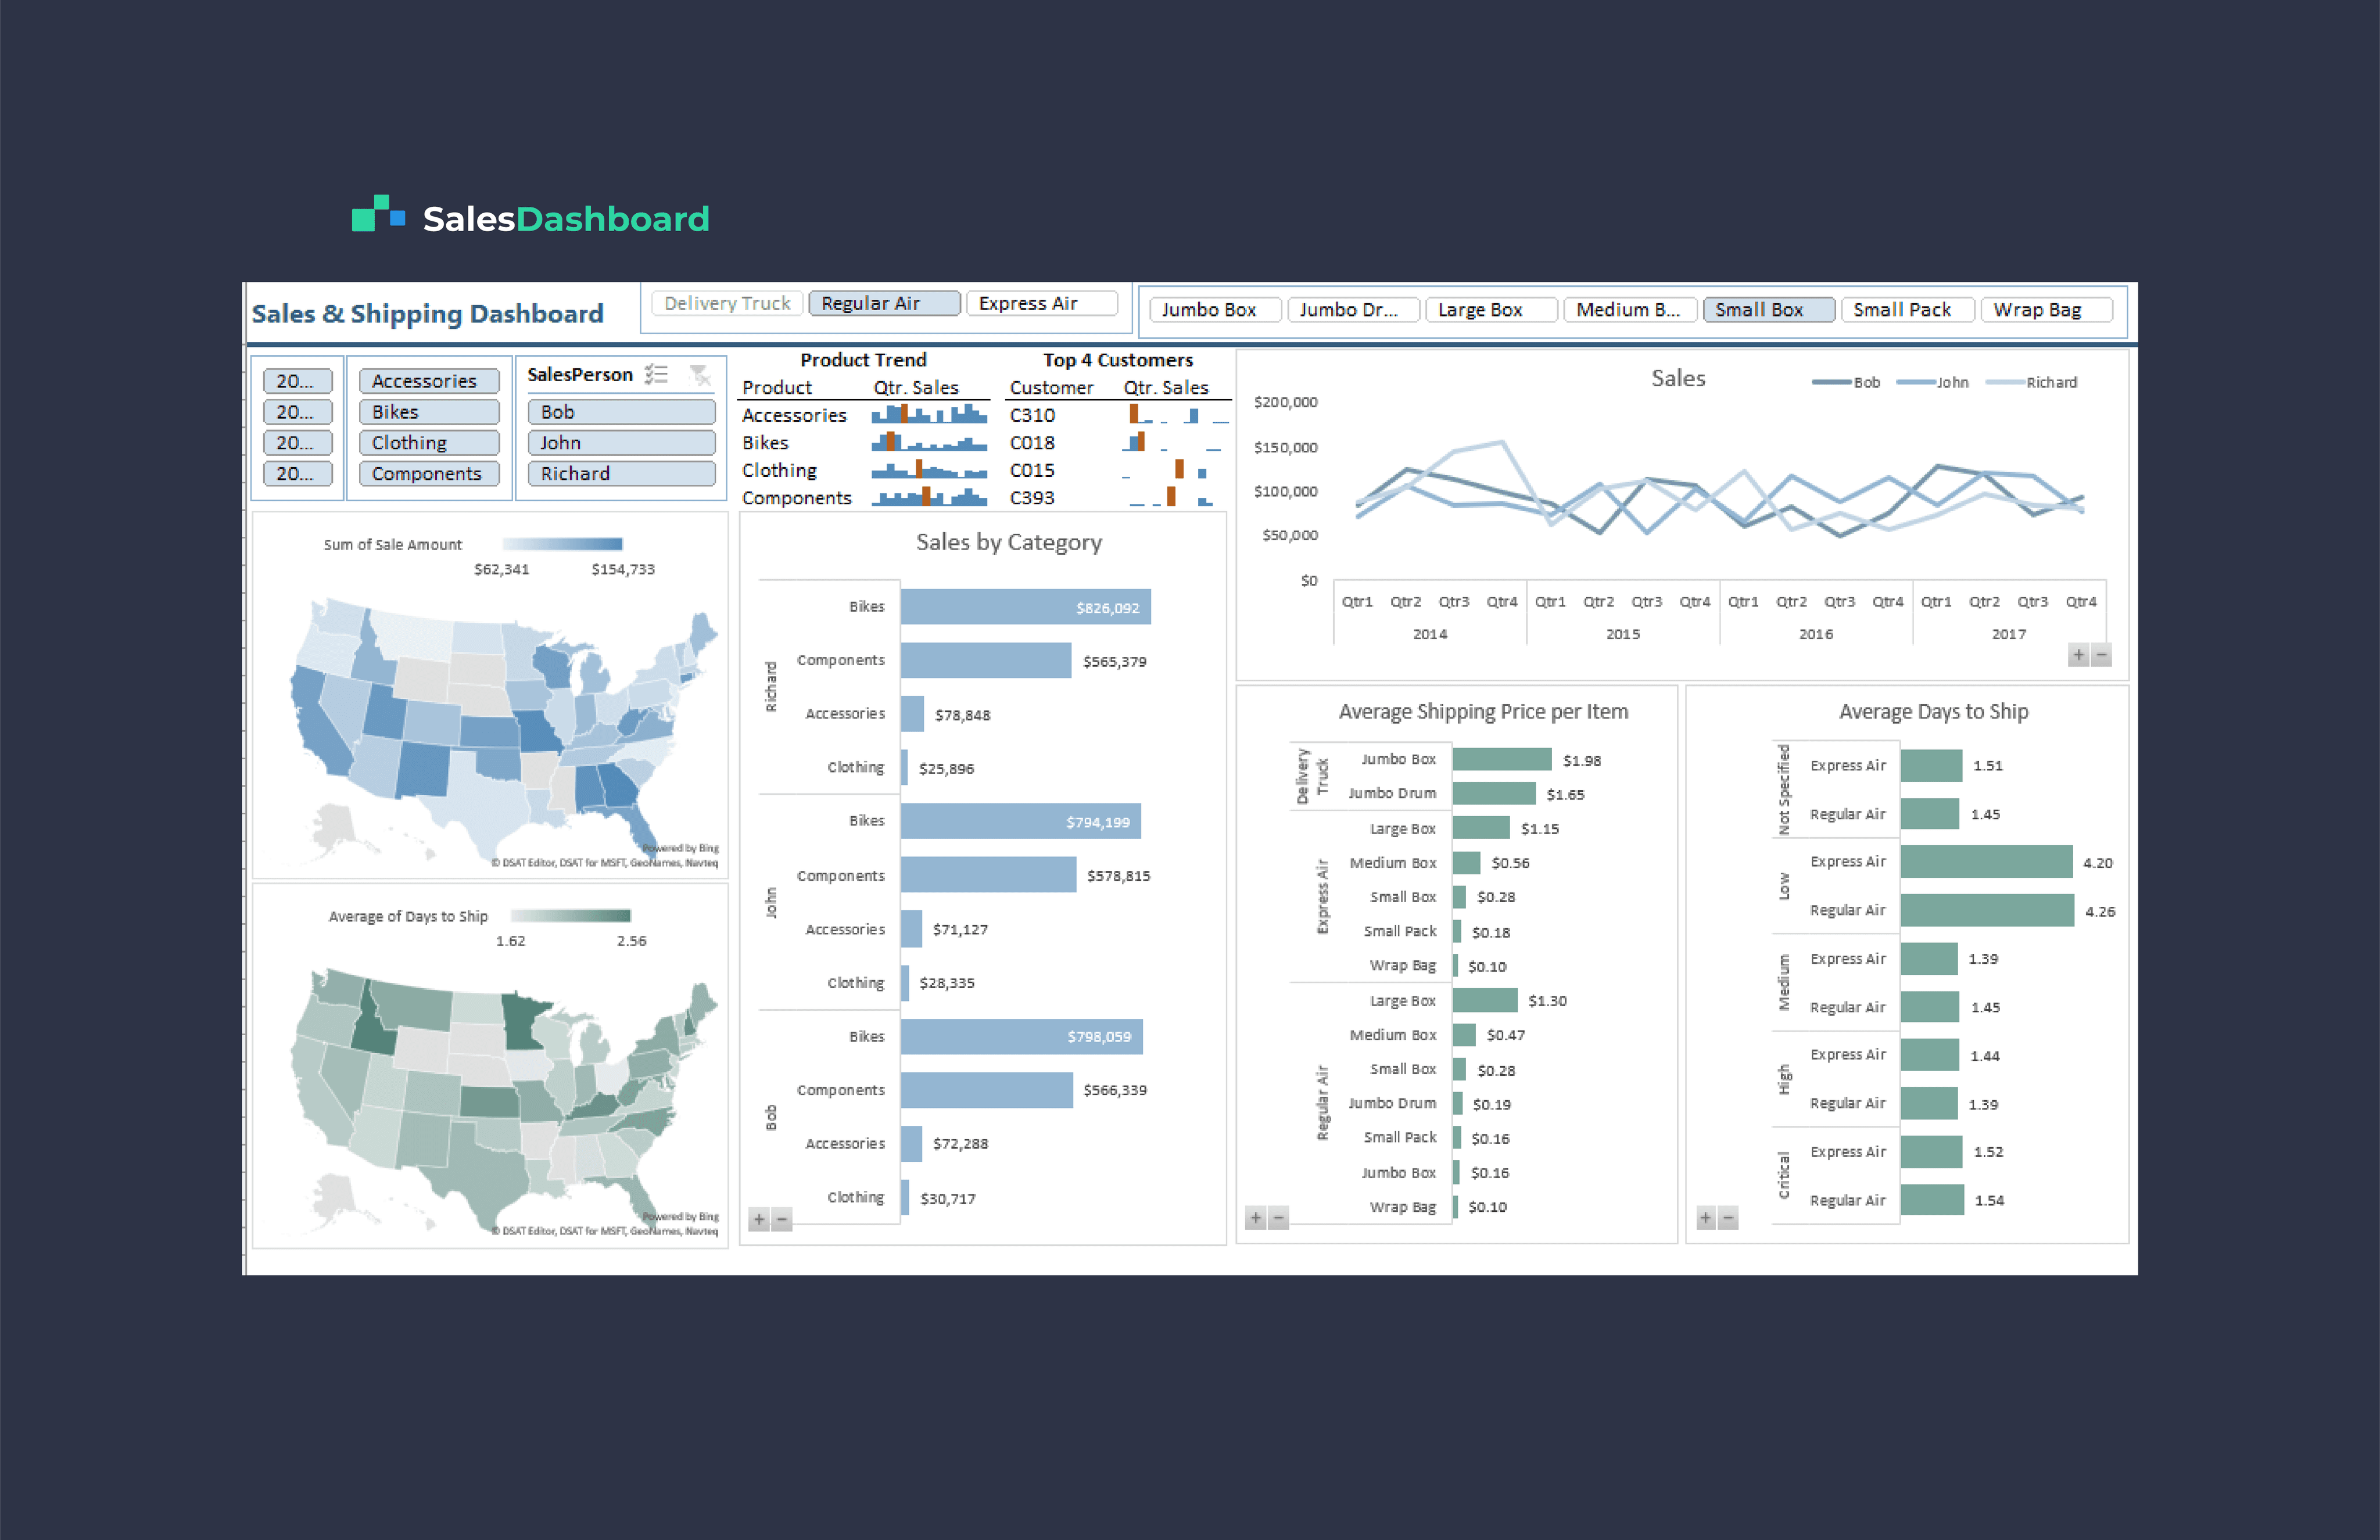
Sales & Shipping Dashboard
Sales & Shipping Dashboard is designed to provide a comprehensive view of sales and shipping data with an emphasis on different filters, key metrics, and graphical representations.
Dashboard covers data from the years 2014 to 2018 and provides filters for accessories, bikes, clothing, and components. It also allows filtering by salesperson and priority levels for shipping. The dashboard highlights several important metrics related to sales, shipping, and customer data.
Client
Acme Placeholder
Role
Designer, Design Director
Services
Visual Identity, Brand Guidelines
The dashboard spans 2014-2018, featuring filters for products, salespeople, and shipping priorities, showcasing essential metrics in sales, shipping, and customer data.
Waqas Ahmad – Data Analyst
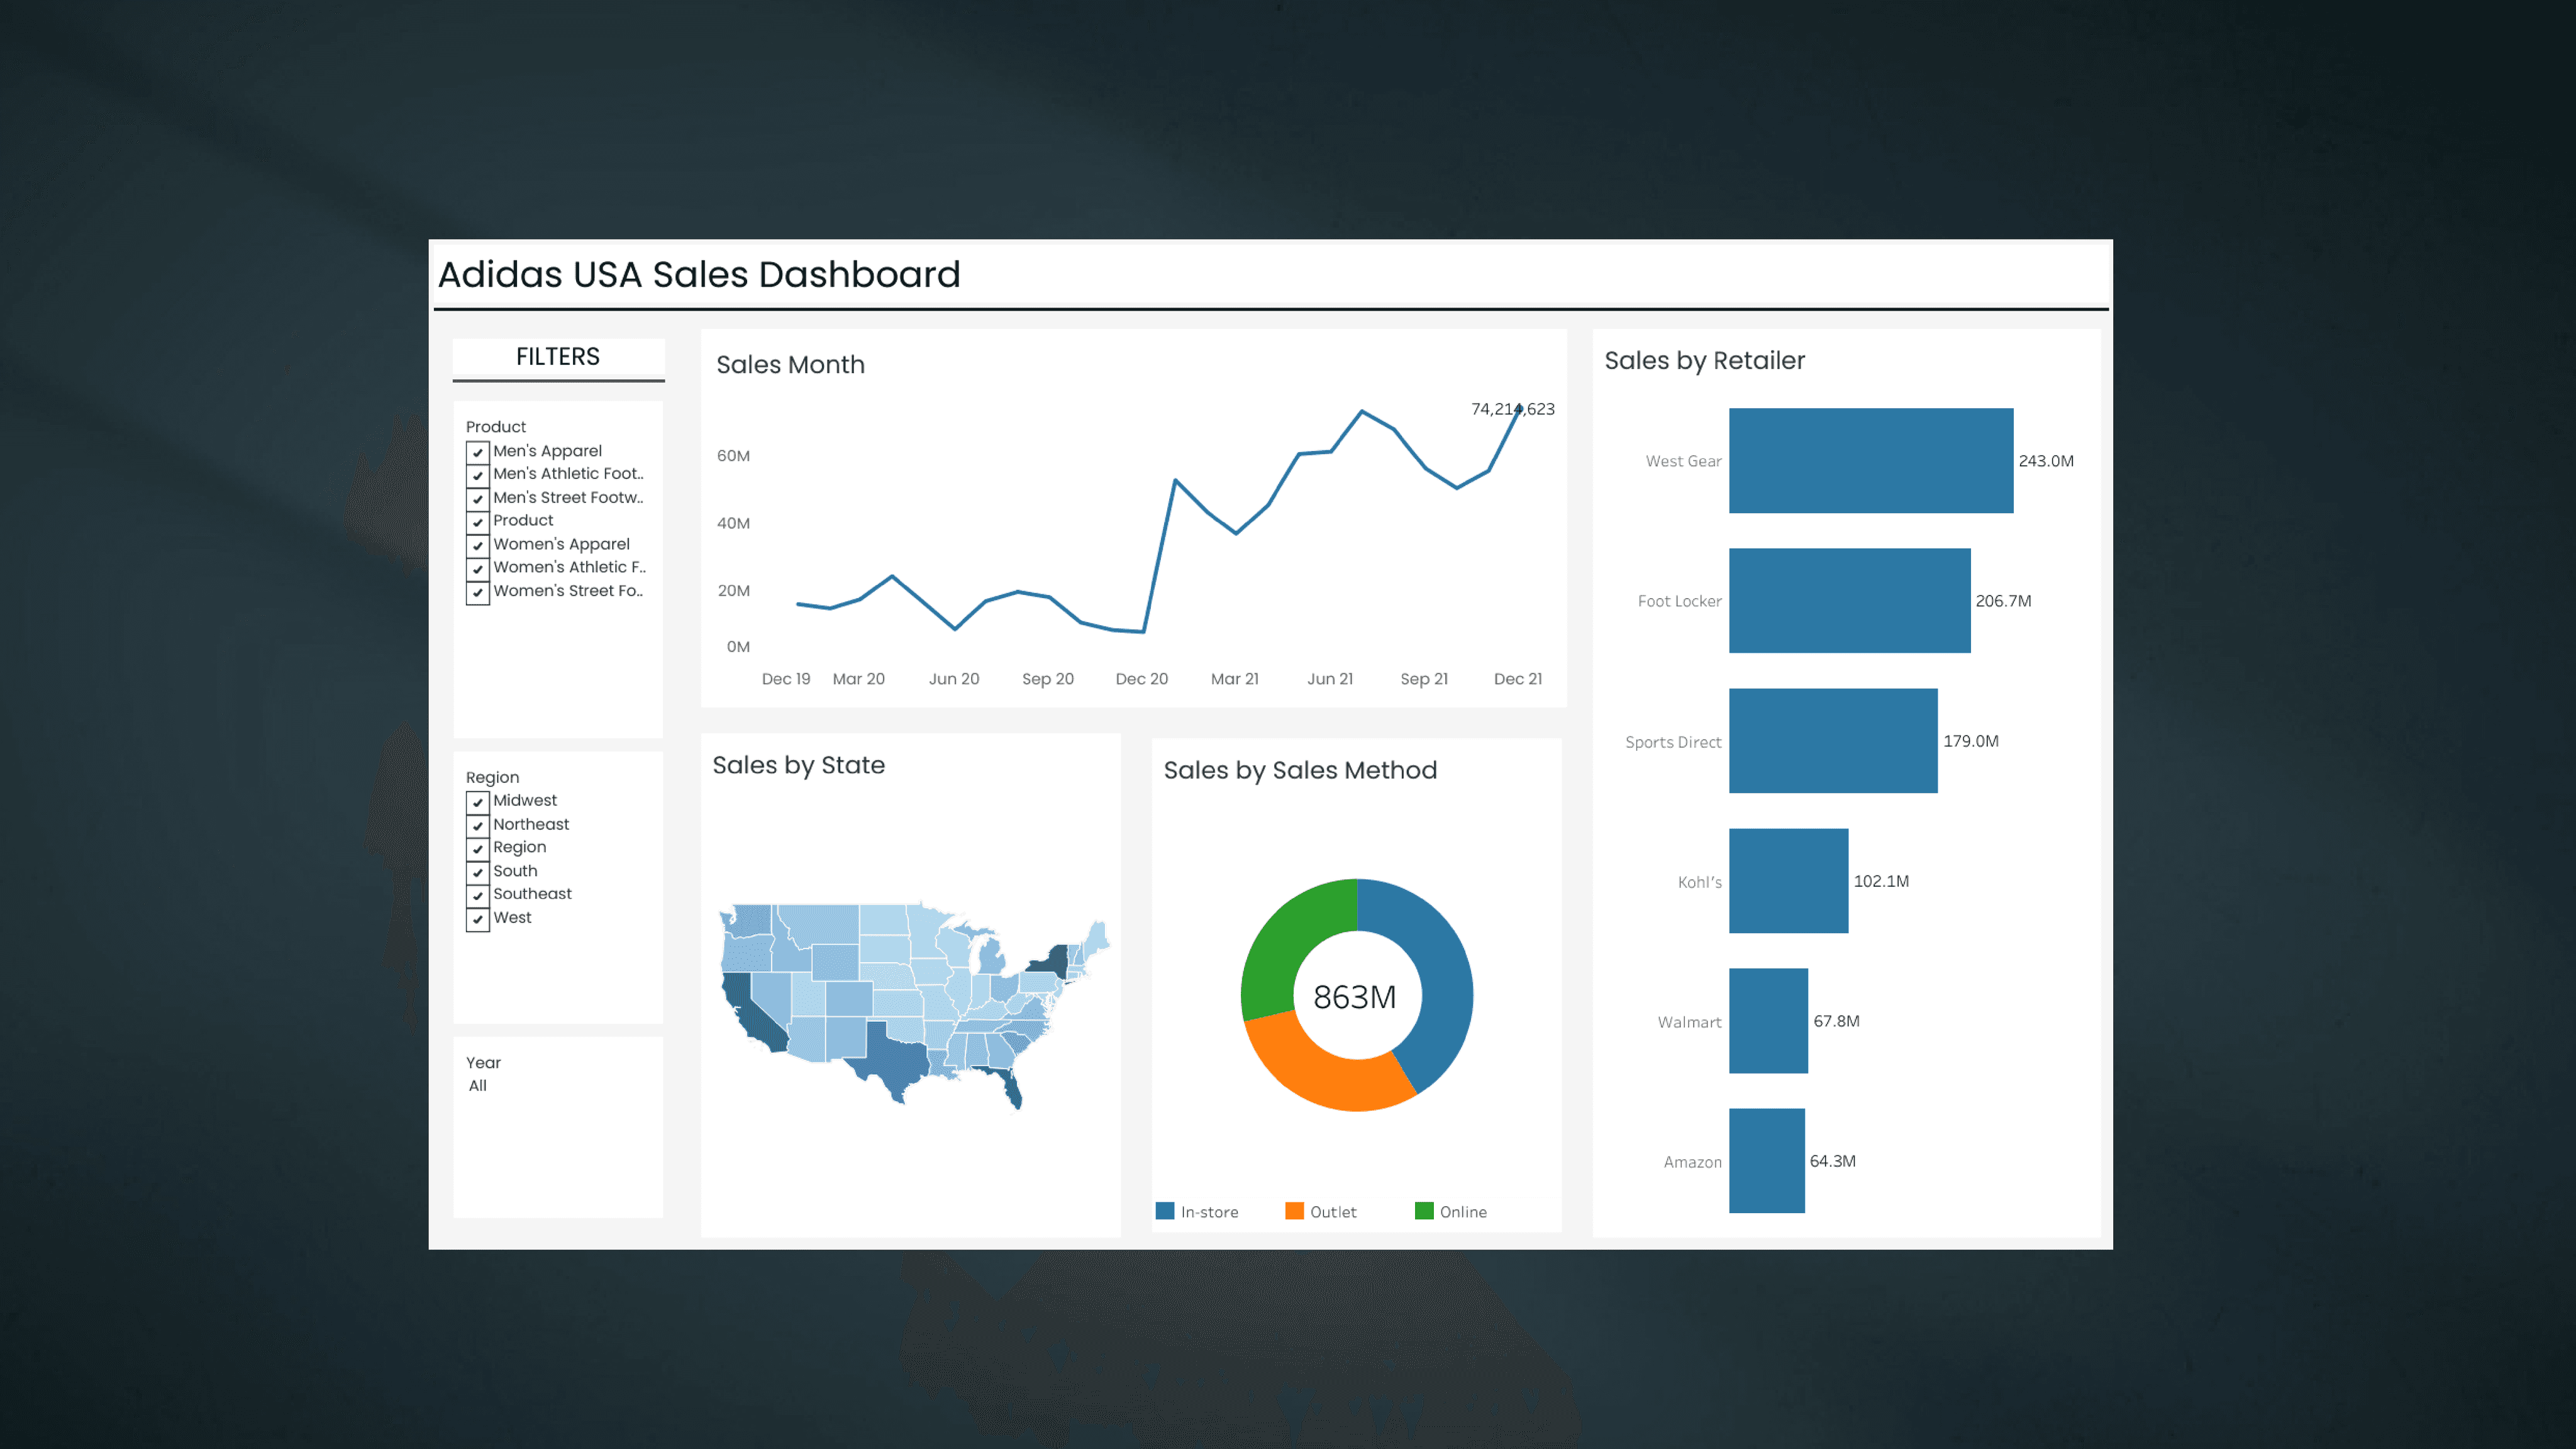
Adidas USA Sales Dashboard
Developed dashboard utilizing the Kaggle dataset that provides valuable insights into sales performance, enabling users to analyze sales trends, examine sales by retailer, method, and state
Created a visually appealing and flexible Adidas USA sales dashboard for comprehensive sales anlysis and allowing them to be filtered by key attributes.
Client
Acme Placeholder
Role
Designer, Design Director
Services
Visual Identity, Brand Guidelines
"The project delivered an intuitive, visually appealing dashboard aligned with client goals"
Waqas Ahmad – Tableau Developer
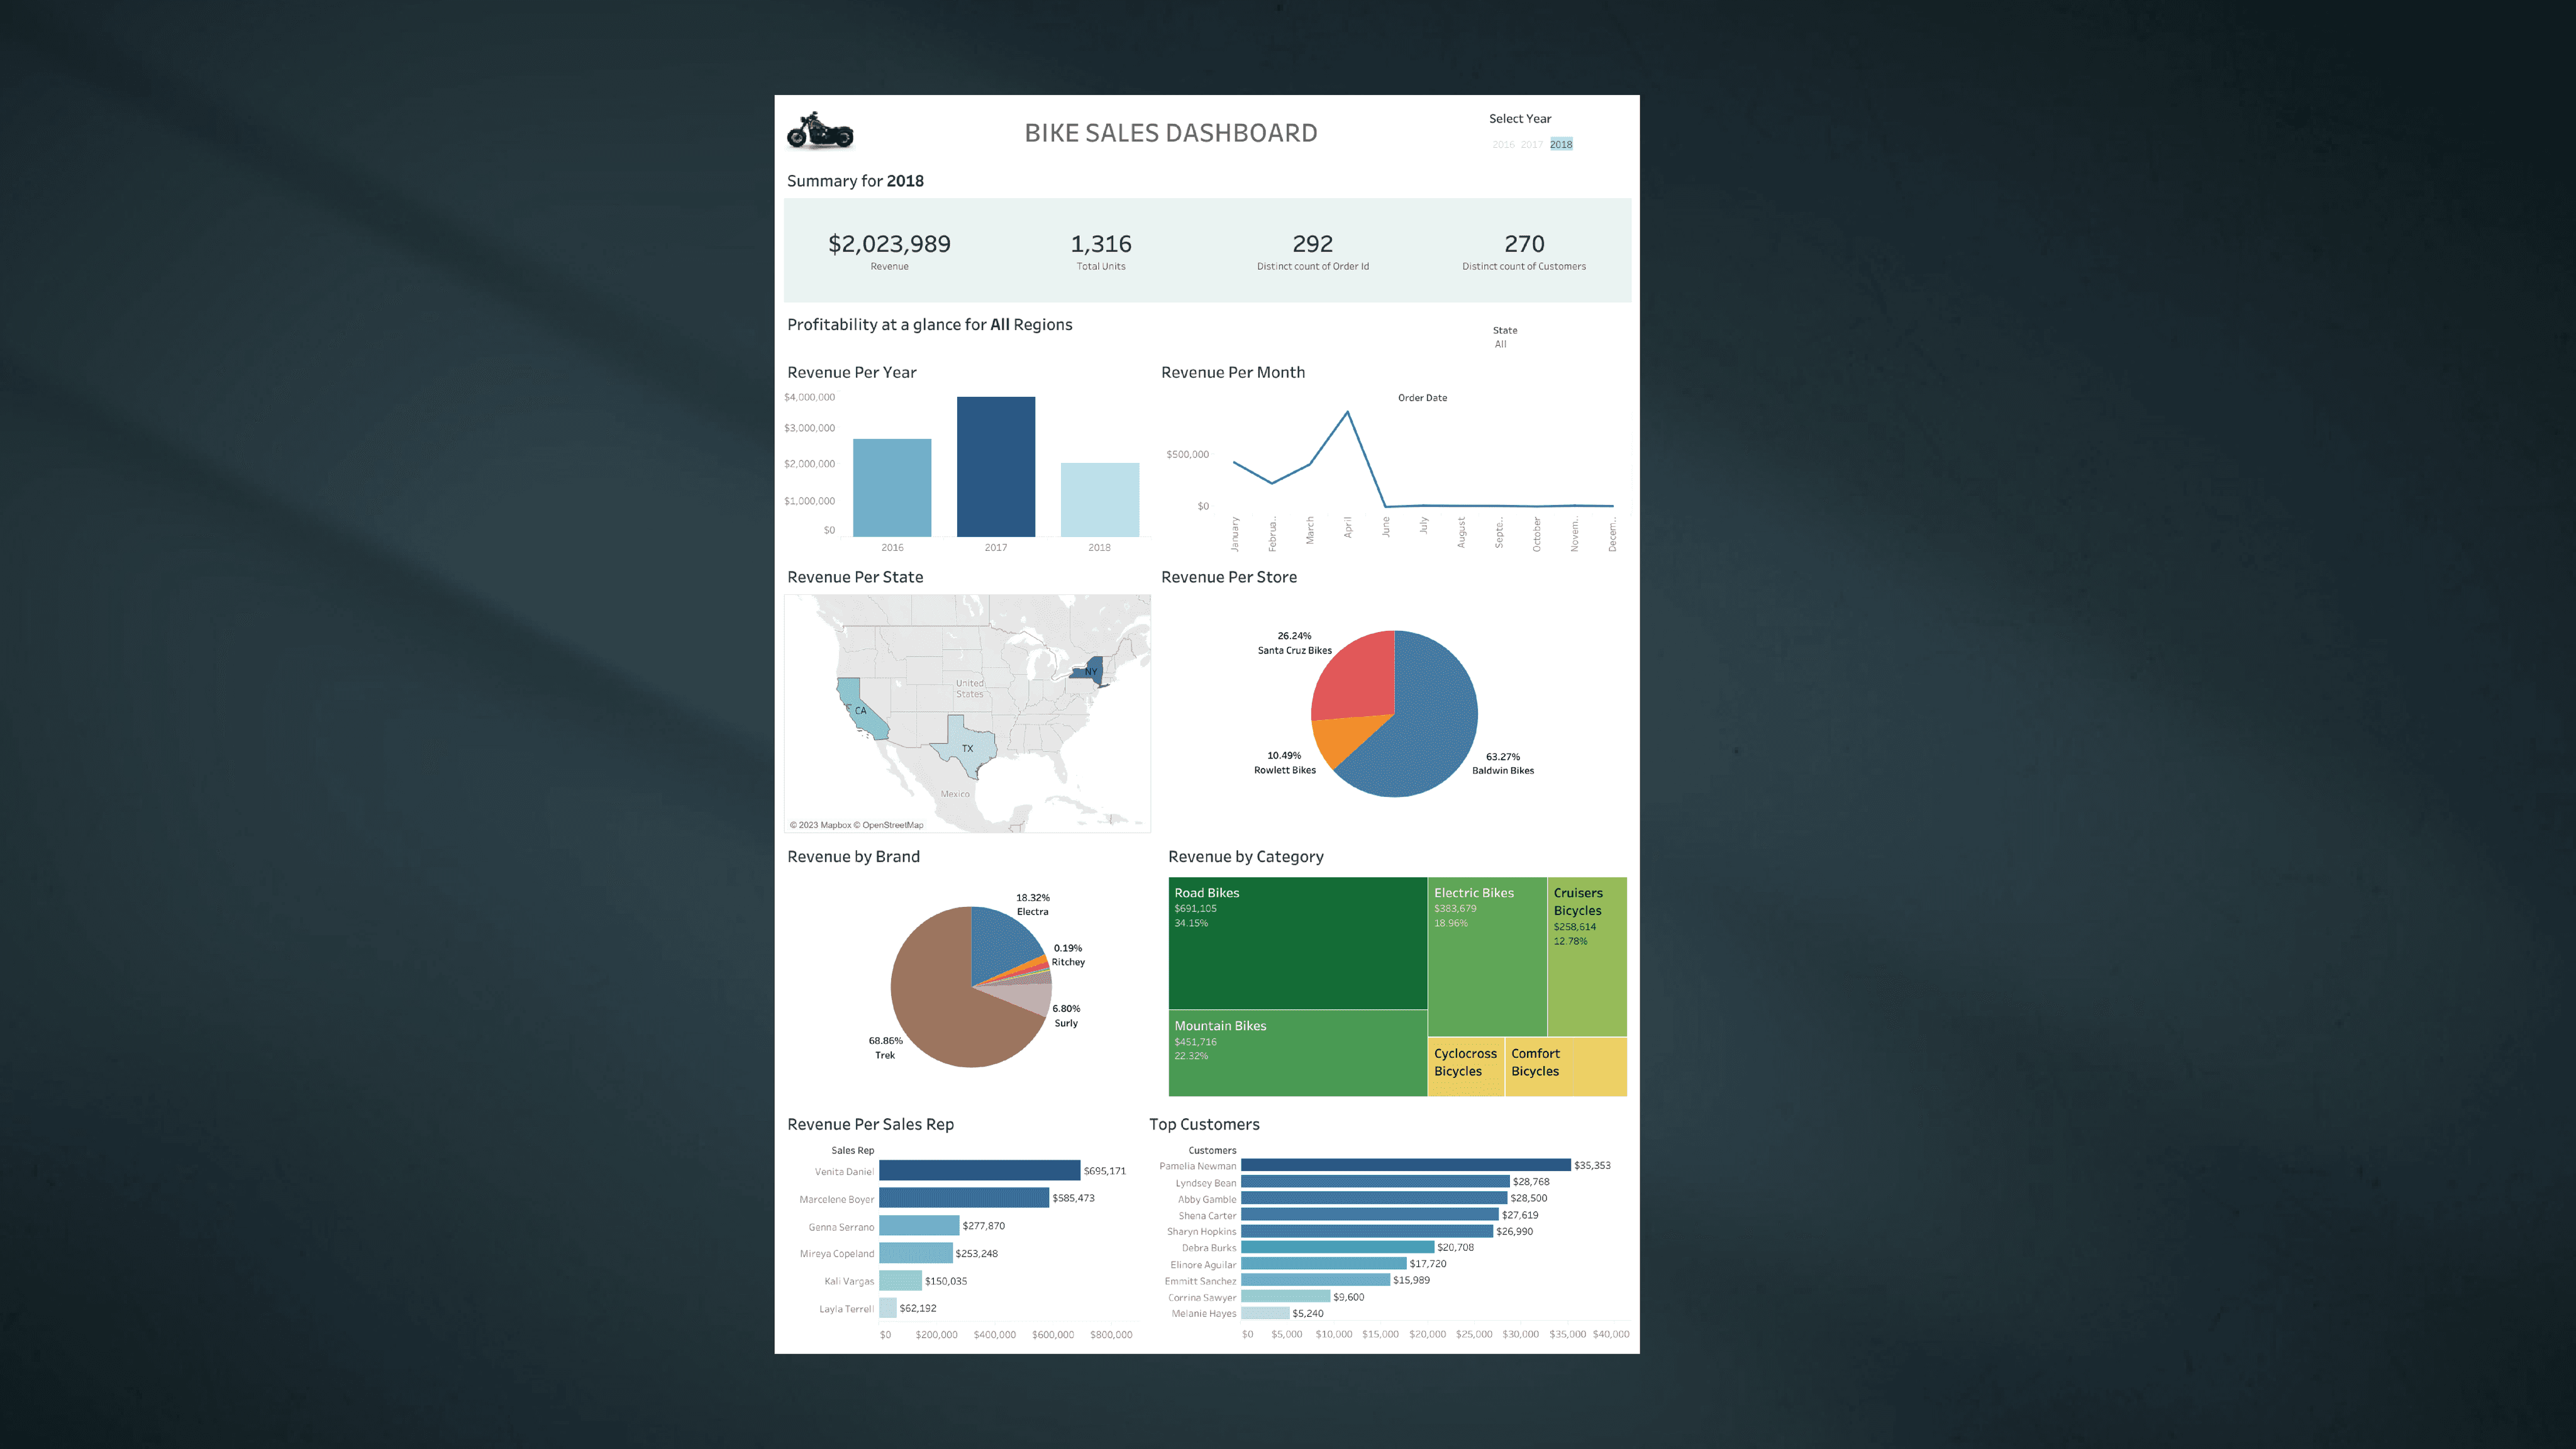
Bike Sales Dashboard
At first glance, it looks like a generic portfolio template but when you take a closer look, you'll see the difference.
Client
Acme Placeholder
Role
Designer, Design Director
Services
Visual Identity, Brand Guidelines
"Working with Jessie Mendez has been an absolute game-changer for our business. We couldn't be happier with the results!"
Michael Scott – Fictional Character
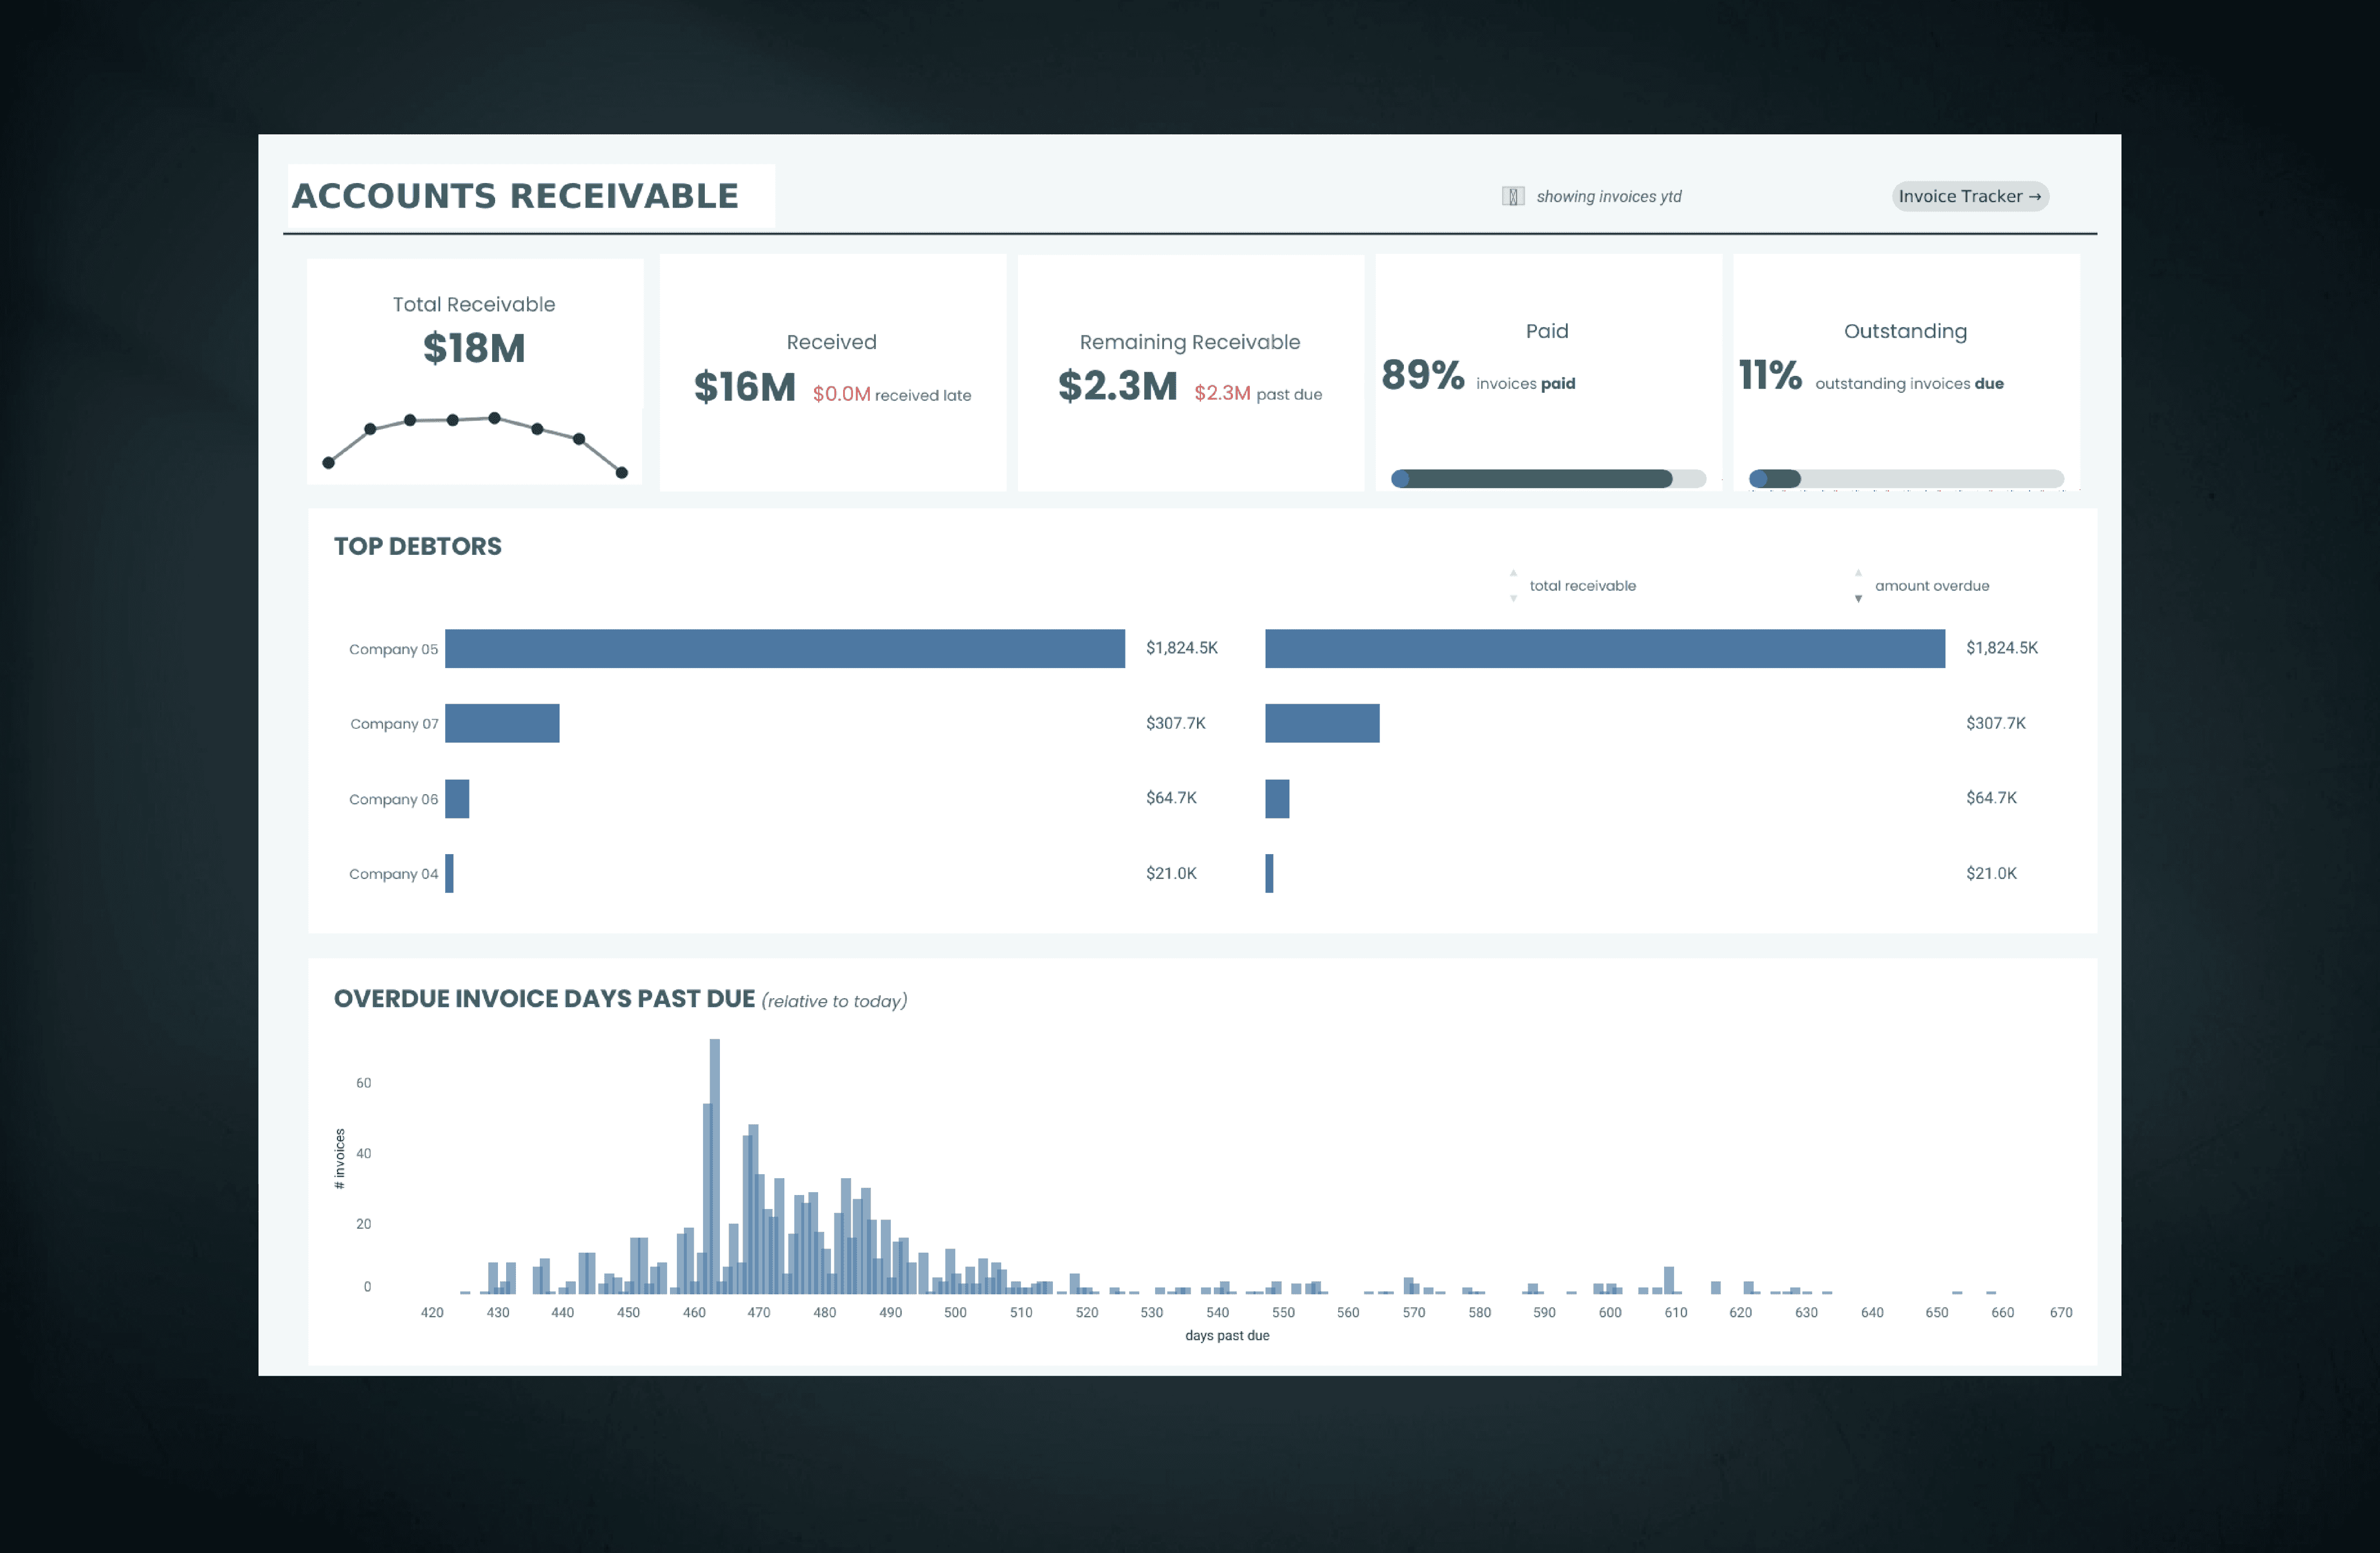
Trade Receivable Dashboard
Developed account receivable dashboard to streamlineclient's invoice management process by centralizing receivables tracking and gaining visibility into payment statuses
Designed a dashboard to monitor total receivables, payments received, remaining balances, paid amounts, outstanding balances, top debtors, and overdue invoices
Client
Selenium Traders
Role
Tableau Developer, Designer
Services
BI, Dashboard Development, Data Visualization
"This streamlined invoice management, enabling the client to prioritize collections and make informed financial decisions. Its user-friendly interface, comprehensive invoice showcase, and efficient filters improved receivables tracking and overall efficiency"
Waqas Ahmad – Tableau Developer
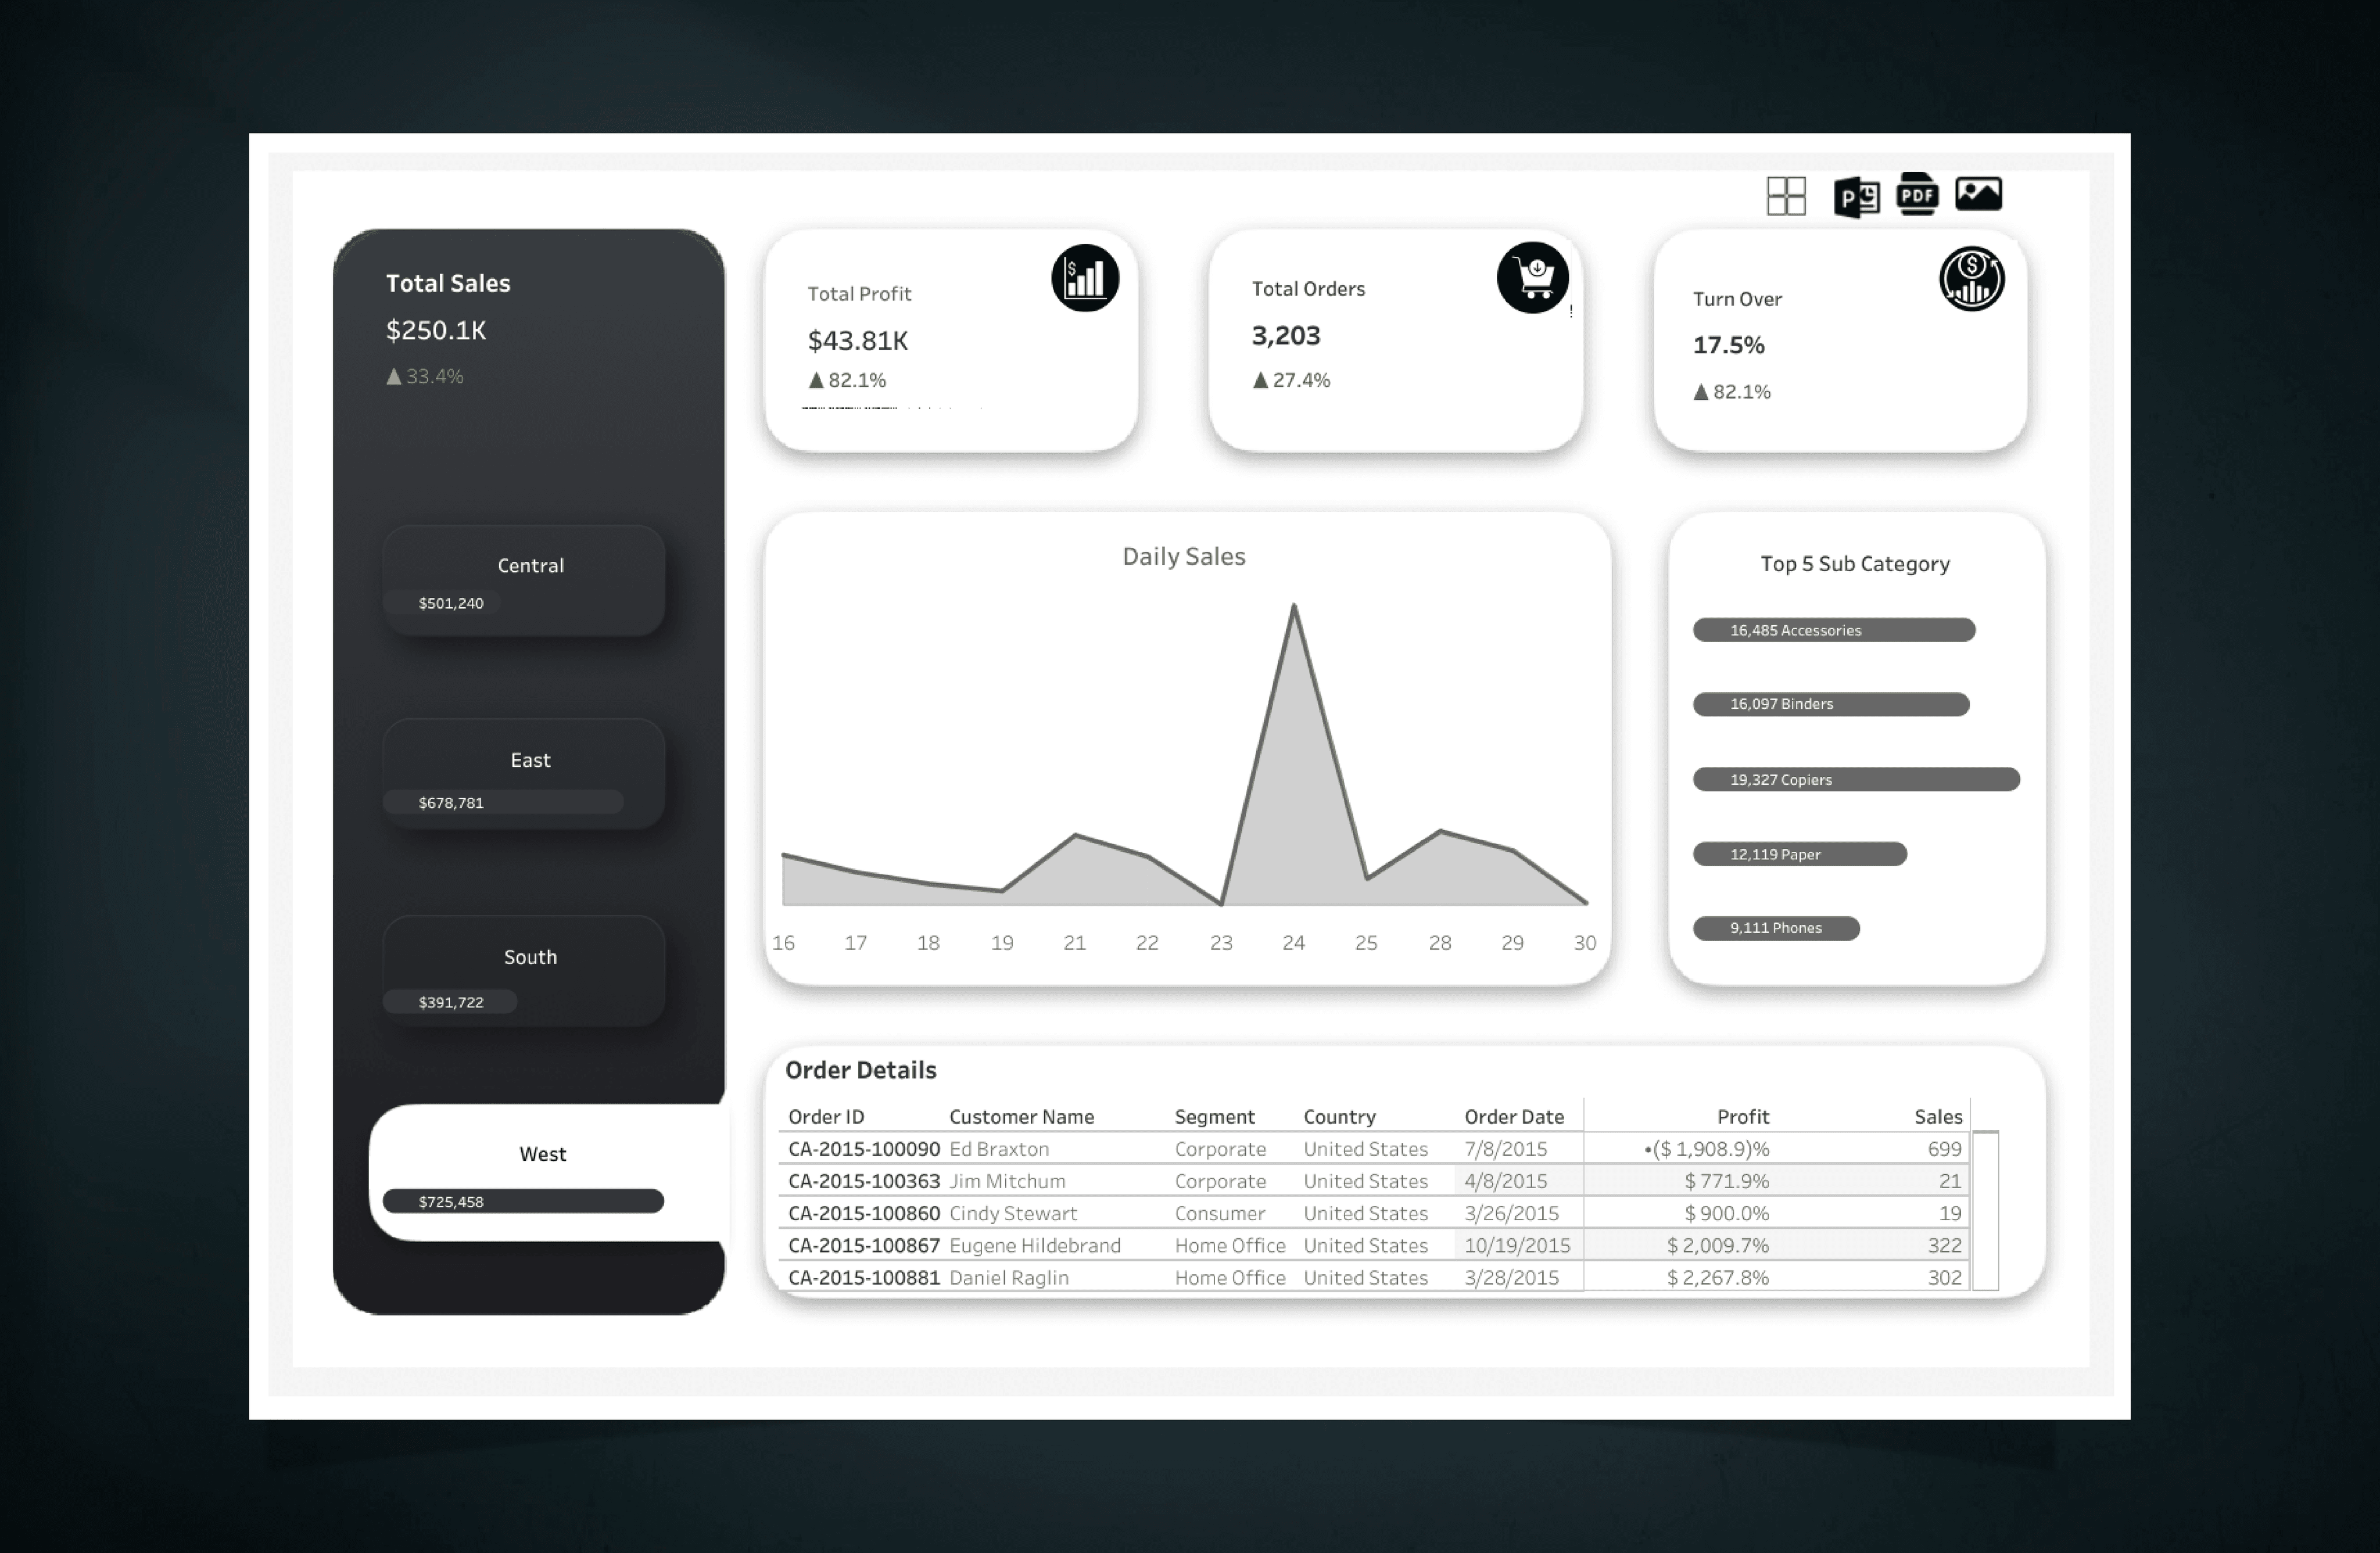
Sales Analysis Dashboard
Developed a robust sales analysis dashboard that empowers businesses to make data-driven decisions, monitor KPIs, and maximize profitability
An interactive sales analysis dashboard that enables our client to understand and track crucial business metrics effortlessly.
Client
Utility Stores
Role
Tableau Developer
Services
BI, Data visualization, Dashboard Development
"With consolidated sales data, visualized KPIs, and intuitive navigation, the dashboard provides critical insights for informed business strategies"
Waqas Ahmad – Tableau Developer
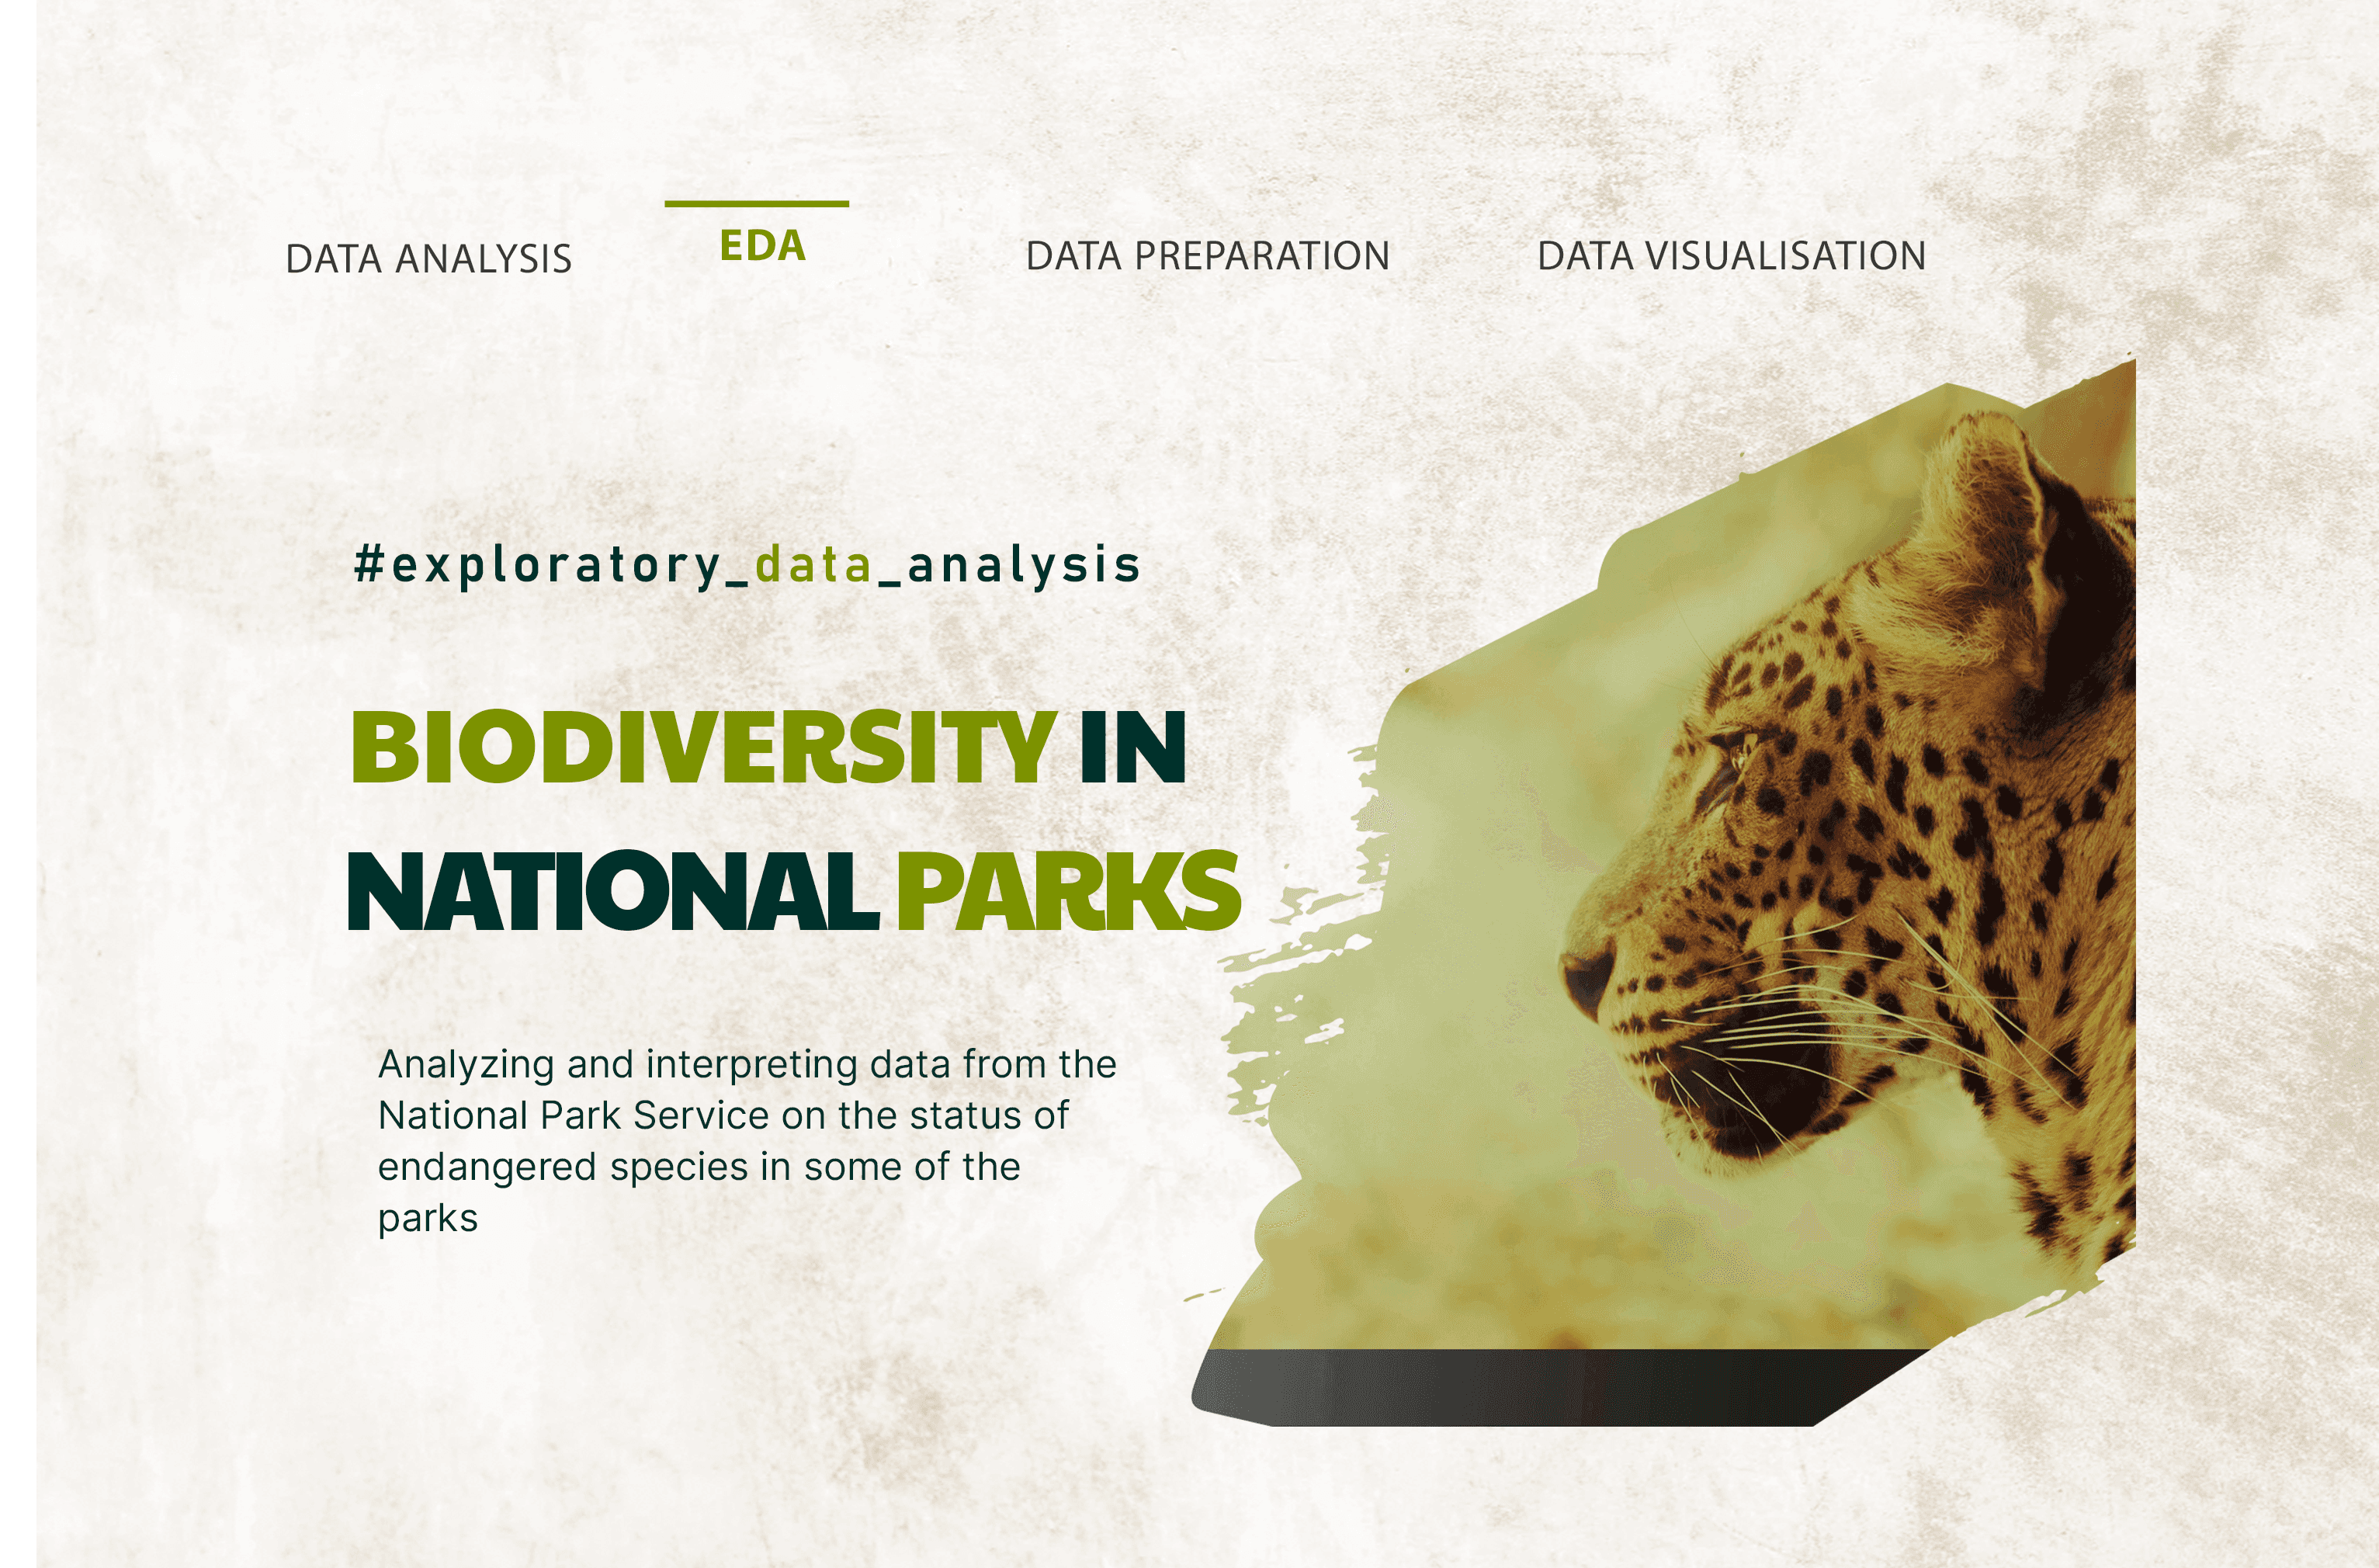
Biodiversity in National Parks
Successfully analyzed and interpret data from the National Park Service and unveiled endangered species in various parks.
Project aims to illuminate various aspects of biodiversity and conservation in national parks. It aims to find out the distribution of species' conservation statuses, identify factors influencing species vulnerability,and differences while also determining the most prevalent park animals and their distribution.
Project Stack
NumPy, Pandas, Matplot, Seaborn
Role
Data Analyst
Services
EDA, Data Viz, Data Storytelling
Most species were not under conservation (5,633 out of 5,824), and mammals and birds showed a higher likelihood of being protected. While there was no significant difference in conservation percentages between mammals and birds, a statistically significant difference existed between mammals and reptiles. Bats were the most frequently observed species, primarily in Yellowstone National Park.
Waqas Ahmad – Data Analyst