Coffee Sales Dashboard - Excel
The Coffee Sales Dashboard is designed to provide comprehensive insights into coffee sales data, enabling users to make data-driven decisions regarding coffee products.
About Project
Dashboard offers filtering options and graphical representations to understand sales trends, coffee types, customer preferences, and regional performance.
Key Features:
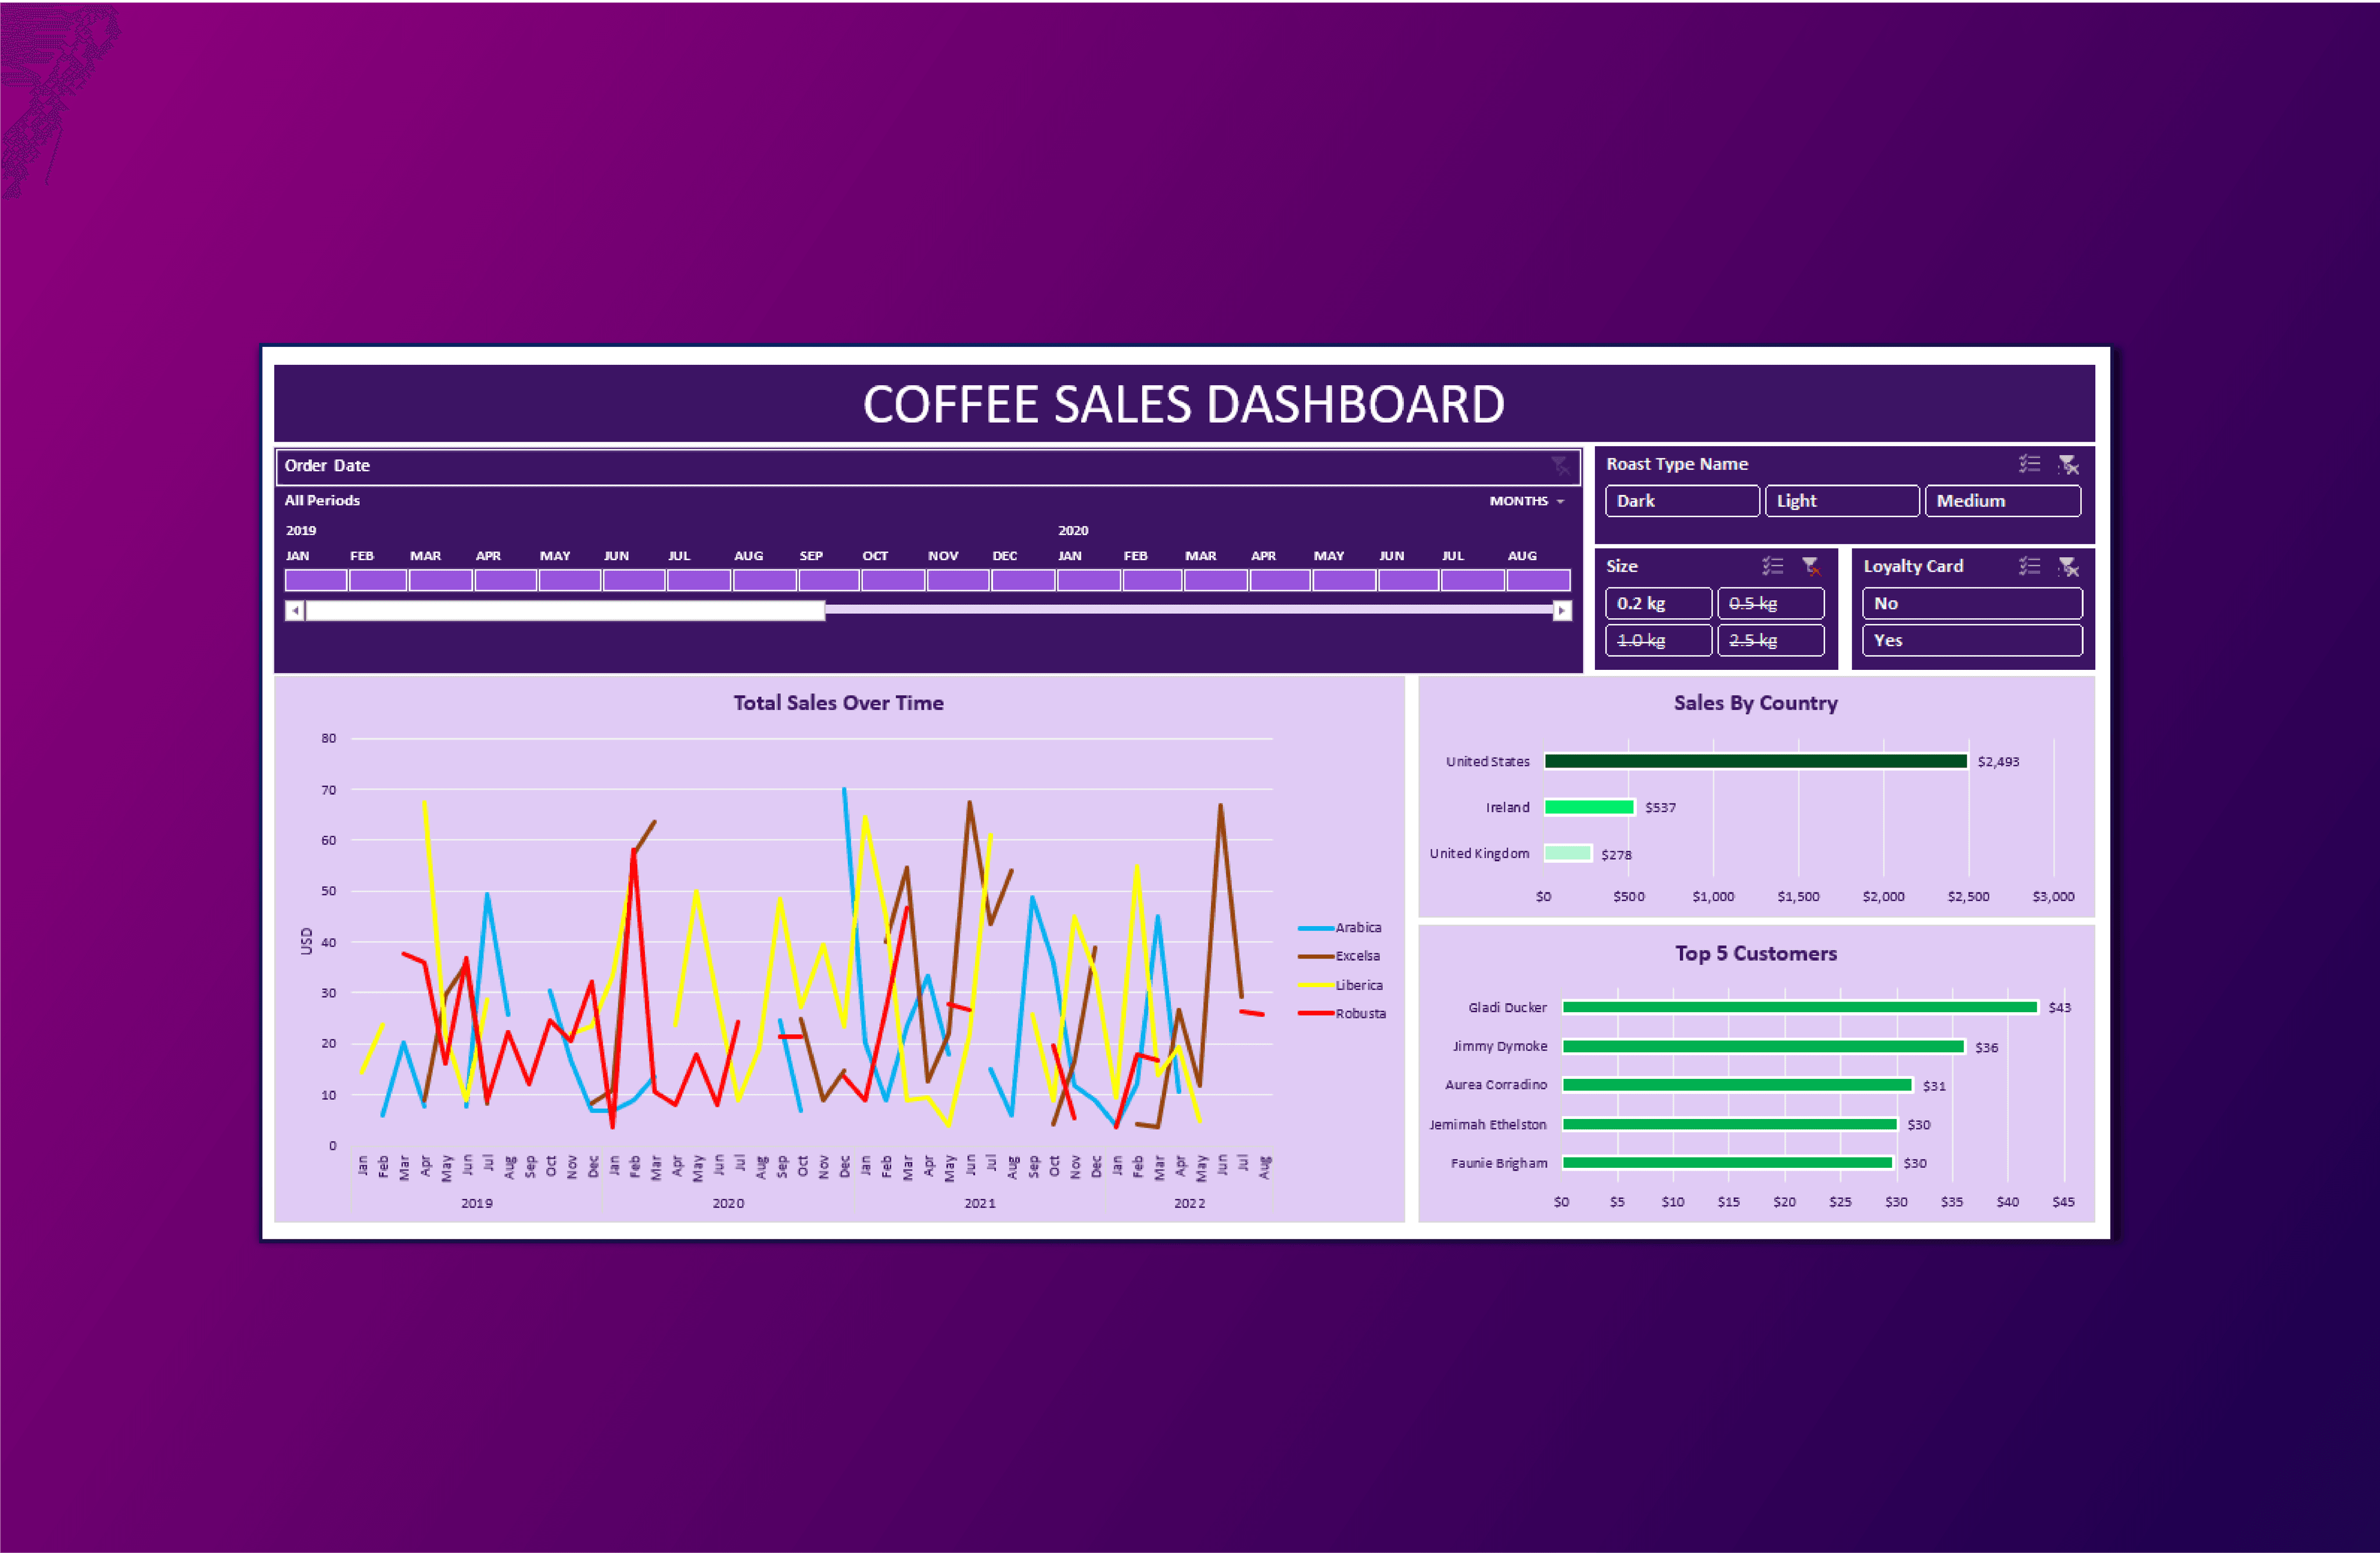
Time Period Selection:
Slicer for filtering by Year, Month, and Period, allowing users to analyze sales data over different time frames.
Roast Type Filter:
Users can filter the data by Roast Type (Dark, Light, Medium) to understand the sales distribution among different coffee roast profiles.
Size Filter:
The dashboard enables filtering by Coffee Size (0.2 kg, 0.5 kg, 1.0 kg, 2.5 kg) to assess the popularity of different package sizes.
Loyalty Card Filter:
Users can filter by Loyalty Card (Yes or No) to compare sales between loyal and non-loyal customers.
Total Sales Over Time (Time Series):
A time series graph displays Total Sales over time, with each Coffee Type represented by distinct colors. This allows for tracking sales trends for various coffee products.
Sales by Country (Bar Graph):
A bar graph presents sales data by country, offering insights into the geographical distribution of sales performance.
Top 5 Customers (Bar Graph):
The dashboard showcases a bar graph highlighting the Top 5 customers, helping identify and reward the most valuable customers.
Key Features:
Time Period Selection:
Slicer for filtering by Year, Month, and Period, allowing users to analyze sales data over different time frames.
Roast Type Filter:
Users can filter the data by Roast Type (Dark, Light, Medium) to understand the sales distribution among different coffee roast profiles.
Size Filter:
The dashboard enables filtering by Coffee Size (0.2 kg, 0.5 kg, 1.0 kg, 2.5 kg) to assess the popularity of different package sizes.
Loyalty Card Filter:
Users can filter by Loyalty Card (Yes or No) to compare sales between loyal and non-loyal customers.
Total Sales Over Time (Time Series):
A time series graph displays Total Sales over time, with each Coffee Type represented by distinct colors. This allows for tracking sales trends for various coffee products.
Sales by Country (Bar Graph):
A bar graph presents sales data by country, offering insights into the geographical distribution of sales performance.
Top 5 Customers (Bar Graph):
The dashboard showcases a bar graph highlighting the Top 5 customers, helping identify and reward the most valuable customers.
"Coffee Sales Dashboard simplifies data analysis, making it easier to track sales trends, understand customer preferences, and evaluate the performance of different coffee types and sizes"
Waqas Ahmad – Data Analyst