Dynamic Fintech Complaint Dashboard

A dynamic fintech complaints dashboard that provides real-time insights into customer complaints and enhance complaints resolution process.
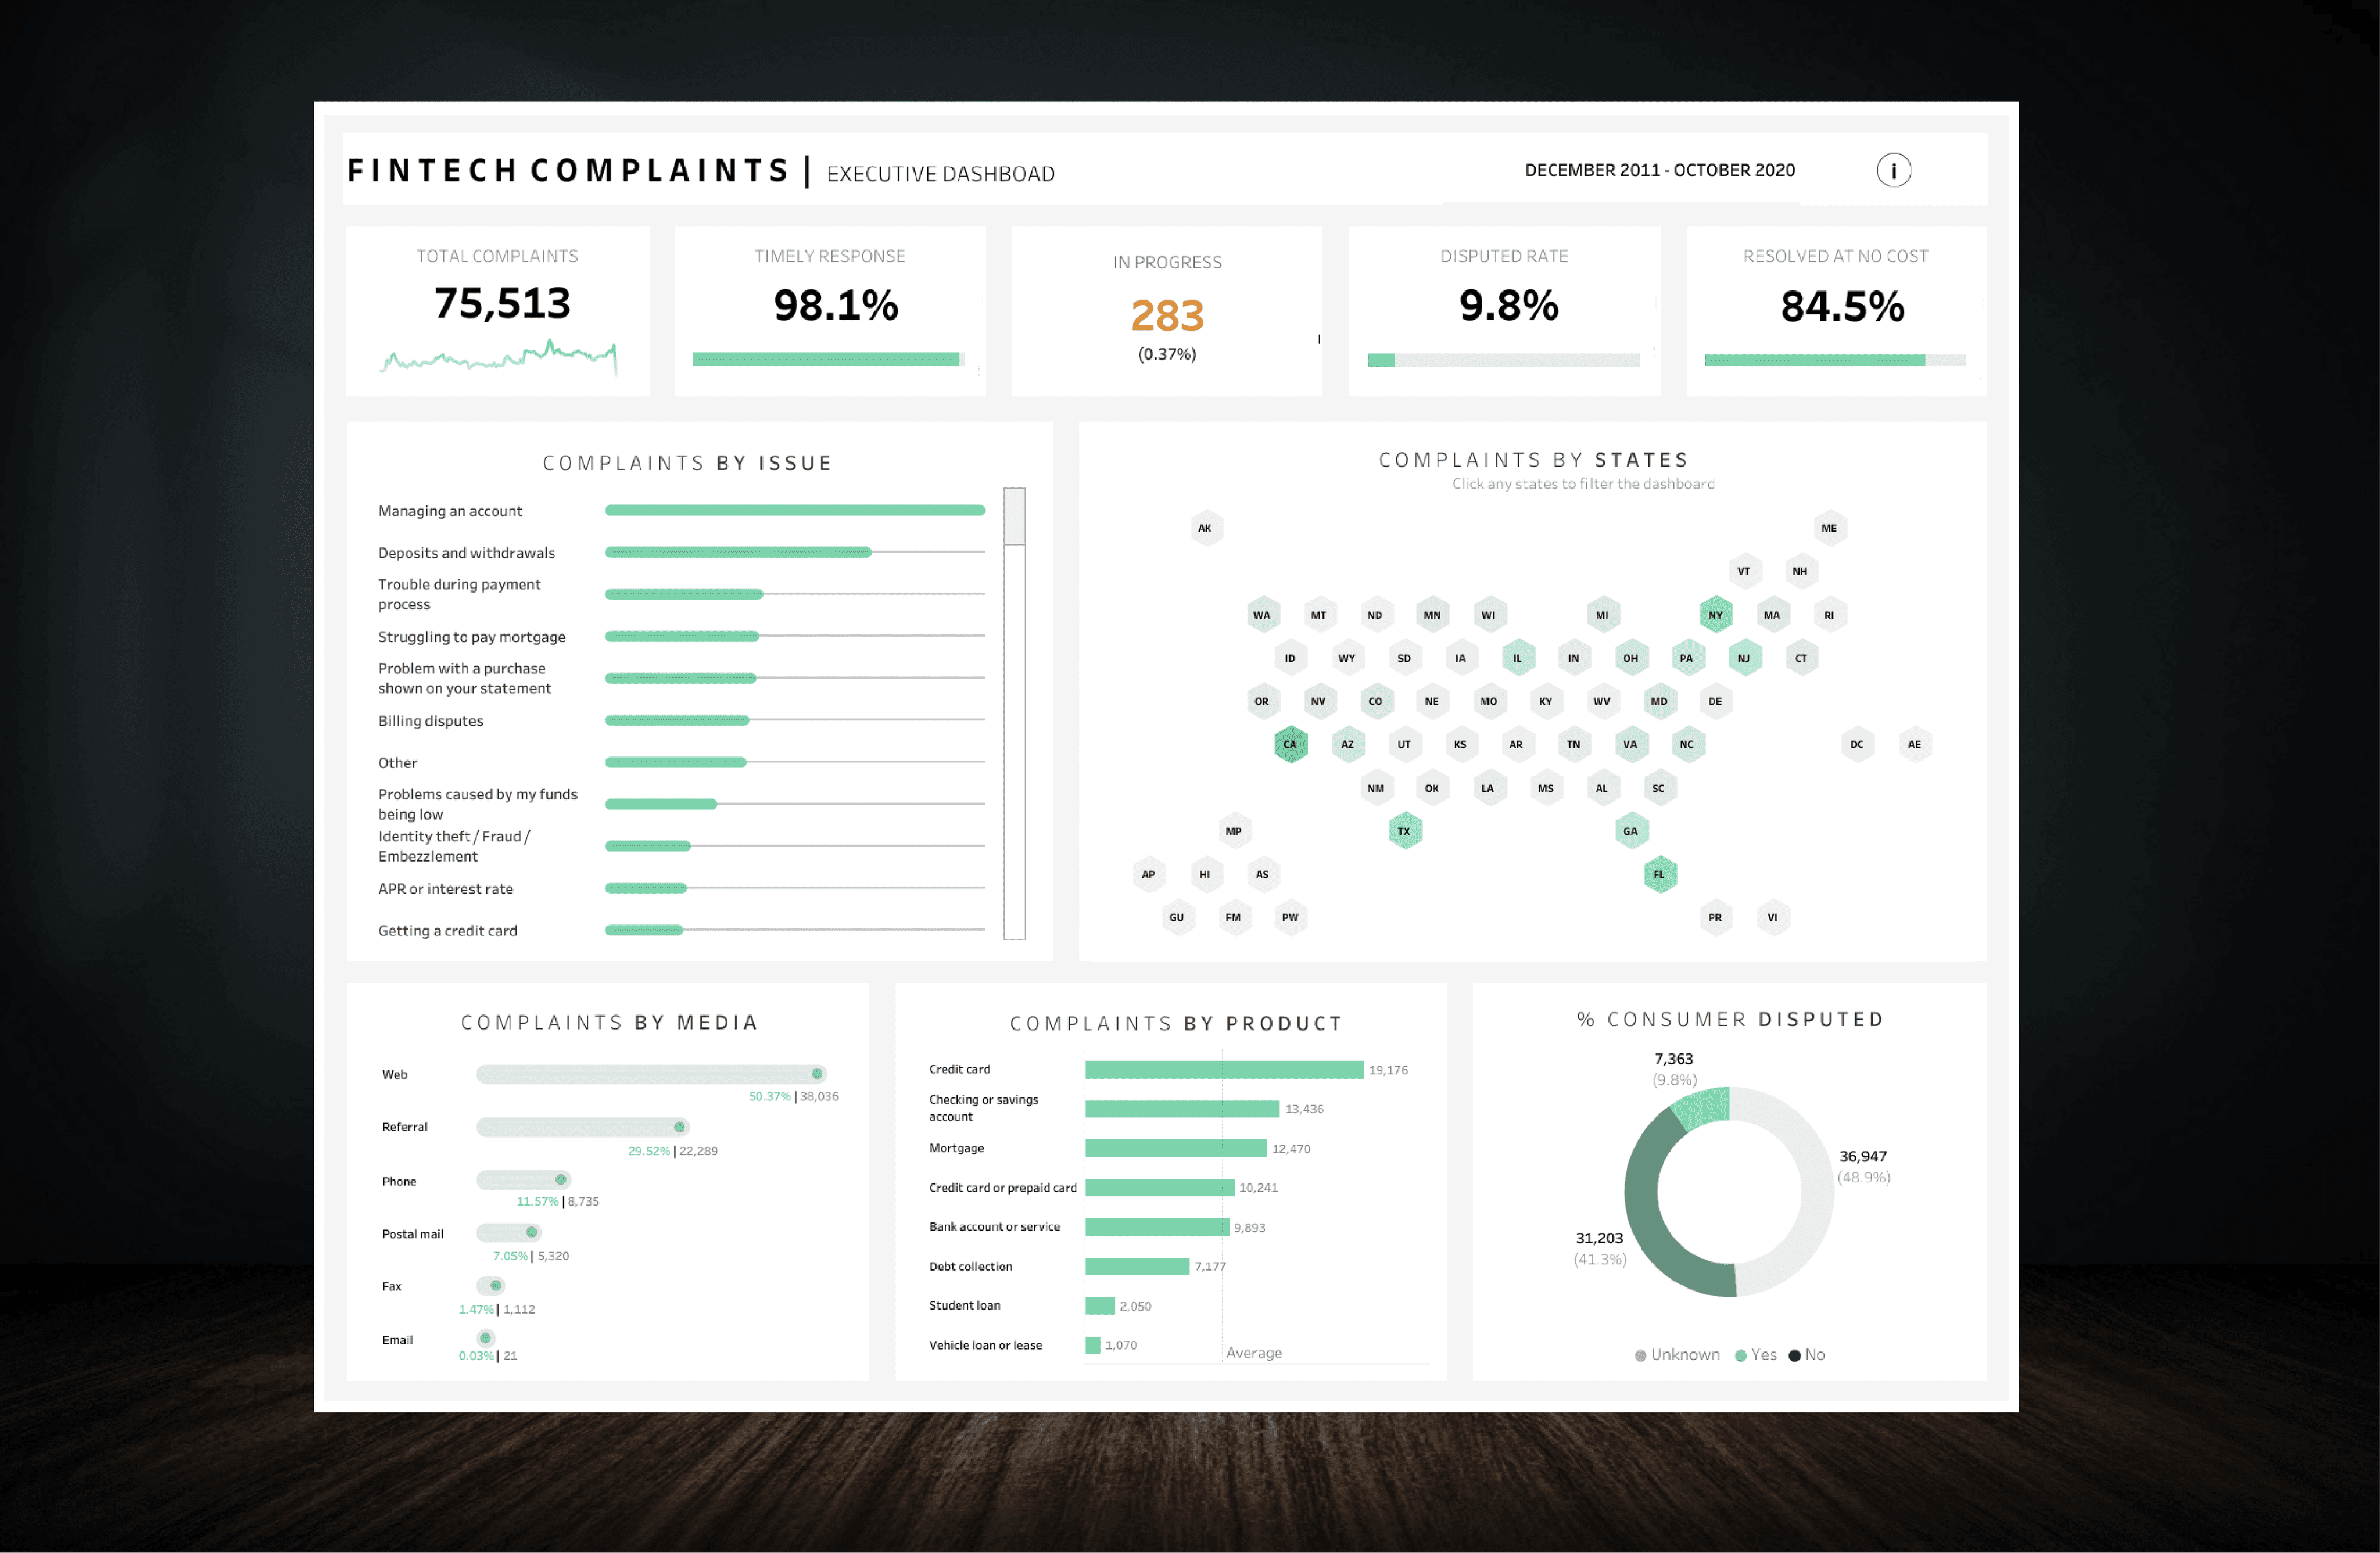
About Project

Dashboard provides real-time updates on KPIs related to complaints that address customer issues promptly, improve customer satisfaction, and reduce dispute rates.

Key Features of the dashboard

  • Total Complaints: KPI for overall complaint volume

  • Timely Response: KPI tracking response time compliance

  • In Progress: KPI shows ongoing complaint resolutions

  • Dispute Rate: Metric indicating the percentage of disputed complaints

  • Resolved at No Cost: KPI displaying cost-free complaint resolutions

  • Complaints by Issue Type: Chart categorizing complaints by types

  • Complaints by Media/State/By Product: Visualizations breaking down complaints by media, state, and product

  • % Consumer Disputed: Pie chart illustrating the percentage of customers who disputed complaints

"Client's complaint management process improved through real-time updates vai comprehensive KPI monitoring, and prompt issue resolution. This led to improved customer satisfaction, reduced dispute rates, streamlined complaint resolution"

Waqas Ahmad – Tableau Developer

Let's collaborate and bring your vision to life!

©2023 Designed by Waqas Ahmad

Going up?

Let's collaborate and bring your vision to life!

©2023 Designed by Waqas Ahmad

Going up?