Adidas USA Sales Dashboard

Developed dashboard utilizing the Kaggle dataset that provides valuable insights into sales performance, enabling users to analyze sales trends, examine sales by retailer, method, and state
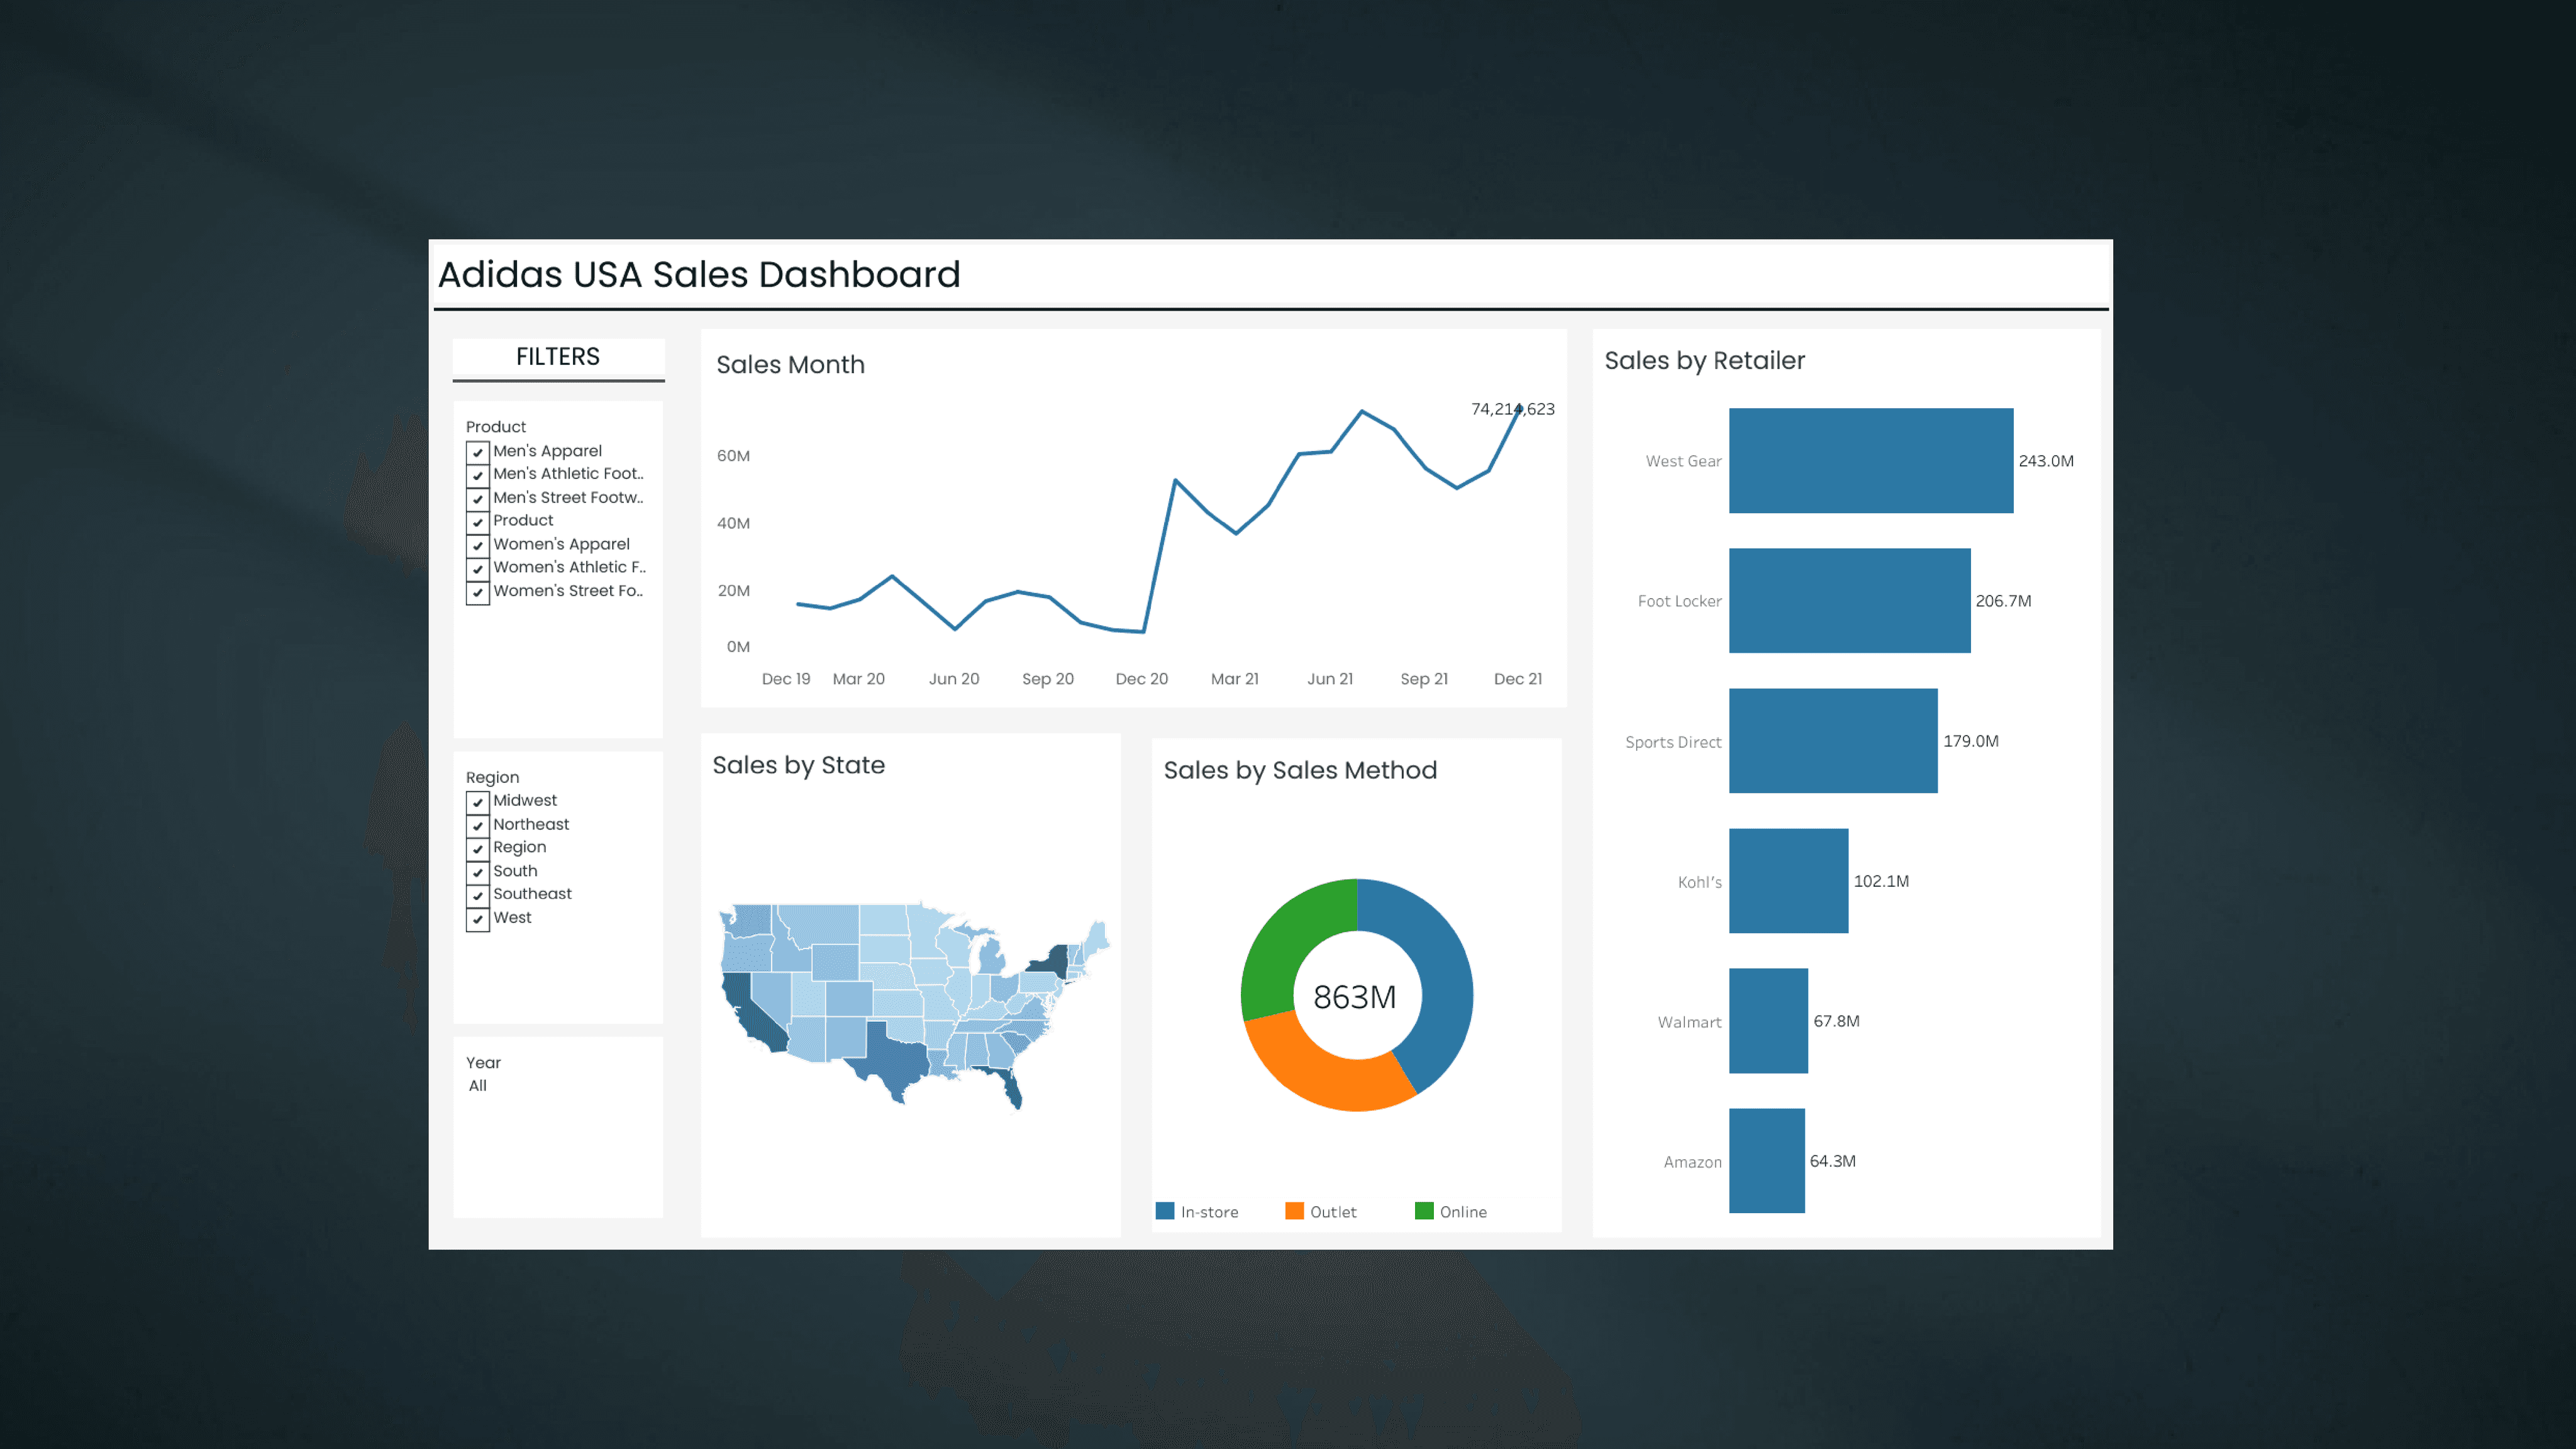
About Project

Created a visually appealing and flexible Adidas USA sales dashboard for comprehensive sales anlysis and allowing them to be filtered by key attributes.

  • Data Preparation: Processed and prepared the data for meaningful representation.

  • Interactive Charts: Implemented interactive elements/ visualizations i.e. sales by month , sales method, state and retailer to enhance data exploration

  • Filter Integration: Added filters for more detailed analysis.

"The project delivered an intuitive, visually appealing dashboard aligned with client goals"

Waqas Ahmad – Tableau Developer

Let's collaborate and bring your vision to life!

©2023 Designed by Waqas Ahmad

Going up?

Let's collaborate and bring your vision to life!

©2023 Designed by Waqas Ahmad

Going up?