Sales Analysis Dashboard
Developed a robust sales analysis dashboard that empowers businesses to make data-driven decisions, monitor KPIs, and maximize profitability
About Project
An interactive sales analysis dashboard that enables our client to understand and track crucial business metrics effortlessly.
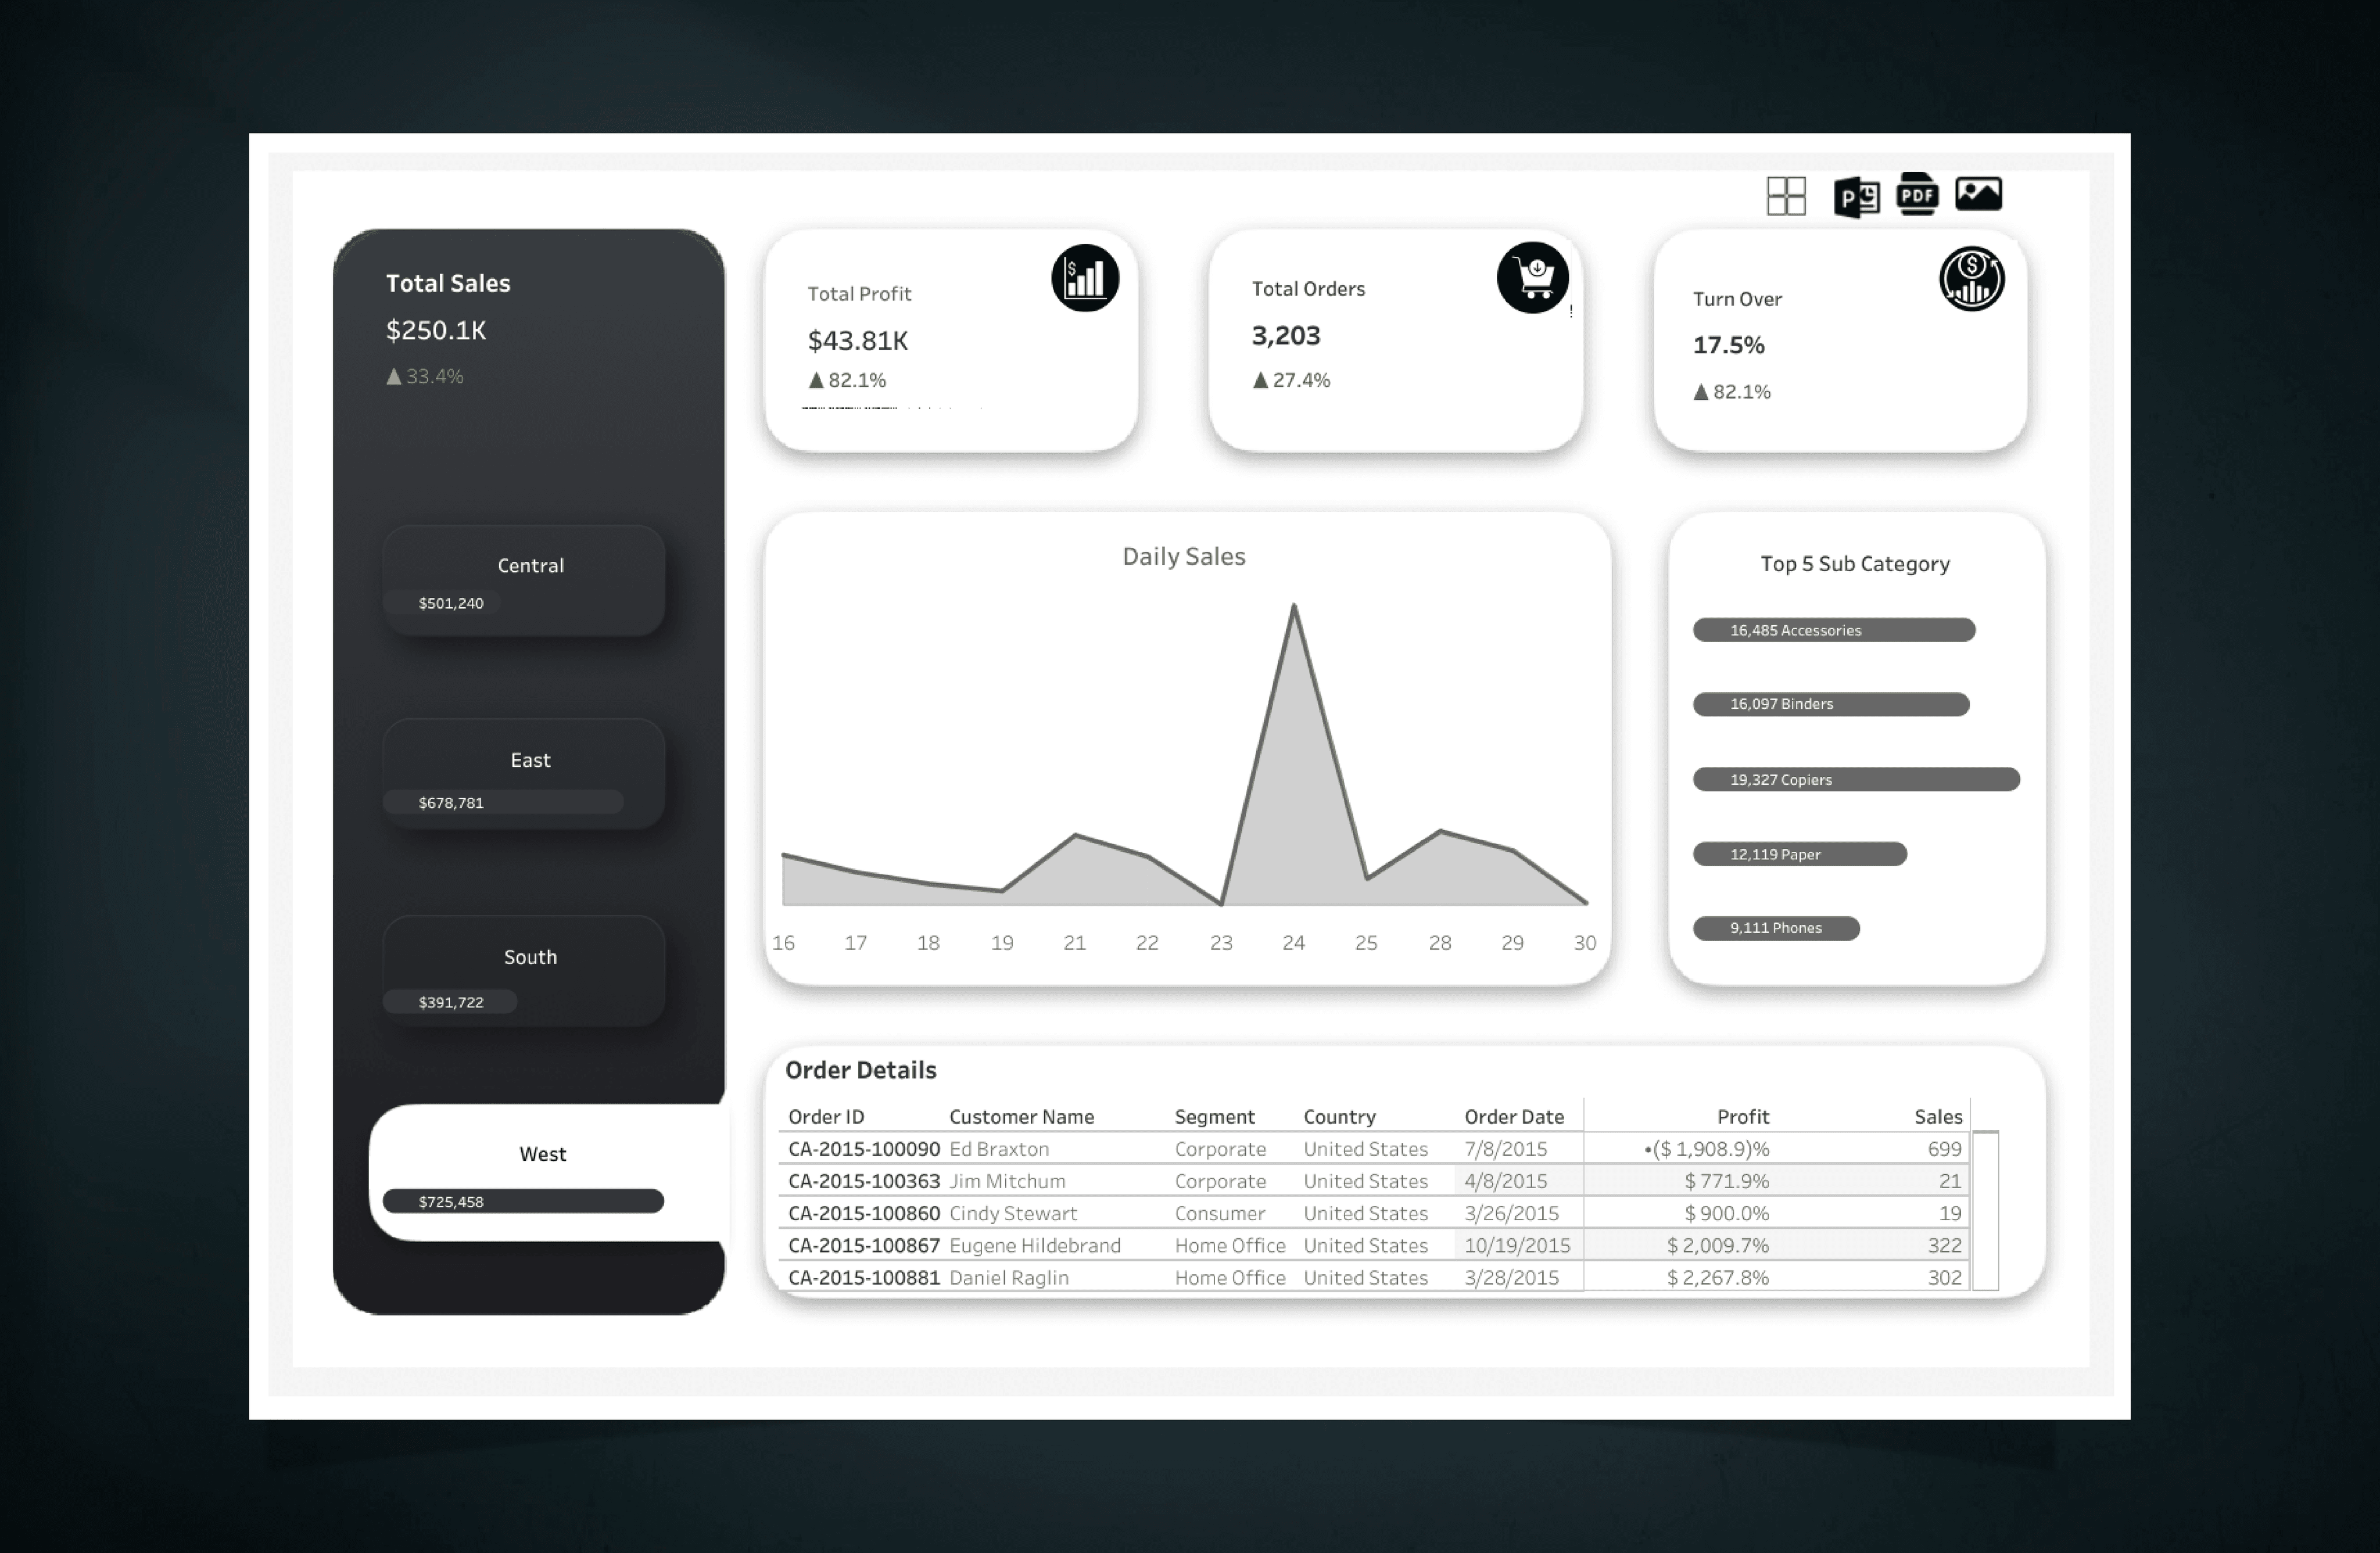
Dashboard provides real-time view of total orders, total profit, and turnover, while also offering a comparative analysis against the previous year's data. Additionally, the dashboard was designed to facilitate regional analysis, enabling the client to evaluate performance across Central, South, East, and West regions.
Data Cleaning and Processing: Enhanced data accuracy and integrity.
KPI Visualization: Displayed KPIs clearly for Total Profit, Orders and Turnover
Comparative Analysis: Year-on-year KPI comparisons for Quick growth/decline assessments.
Regional Analysis: Analyzed sales across regions to Identify trends and opportunities.
Additional Insights: Daily sales chart for patterns and Top subcategories and order details.
"With consolidated sales data, visualized KPIs, and intuitive navigation, the dashboard provides critical insights for informed business strategies"
Waqas Ahmad – Tableau Developer